Indicator Overview
The OBOS 1.00 indicator is a simple momentum tool designed to show overbought and oversold conditions using a smooth oscillator-style line. It helps traders quickly gauge when the market may be stretched in one direction and potentially preparing for a pullback or a shift in momentum. The histogram-style display provides a clear visual cue of positive and negative momentum changes.
The indicator works on any timeframe and can be used in both trend-following and mean-reversion strategies. Its structure makes it easy to read at a glance without requiring additional filters or complex interpretation.
How to Use It in Practice

In real trading, OBOS 1.00 can be used to:
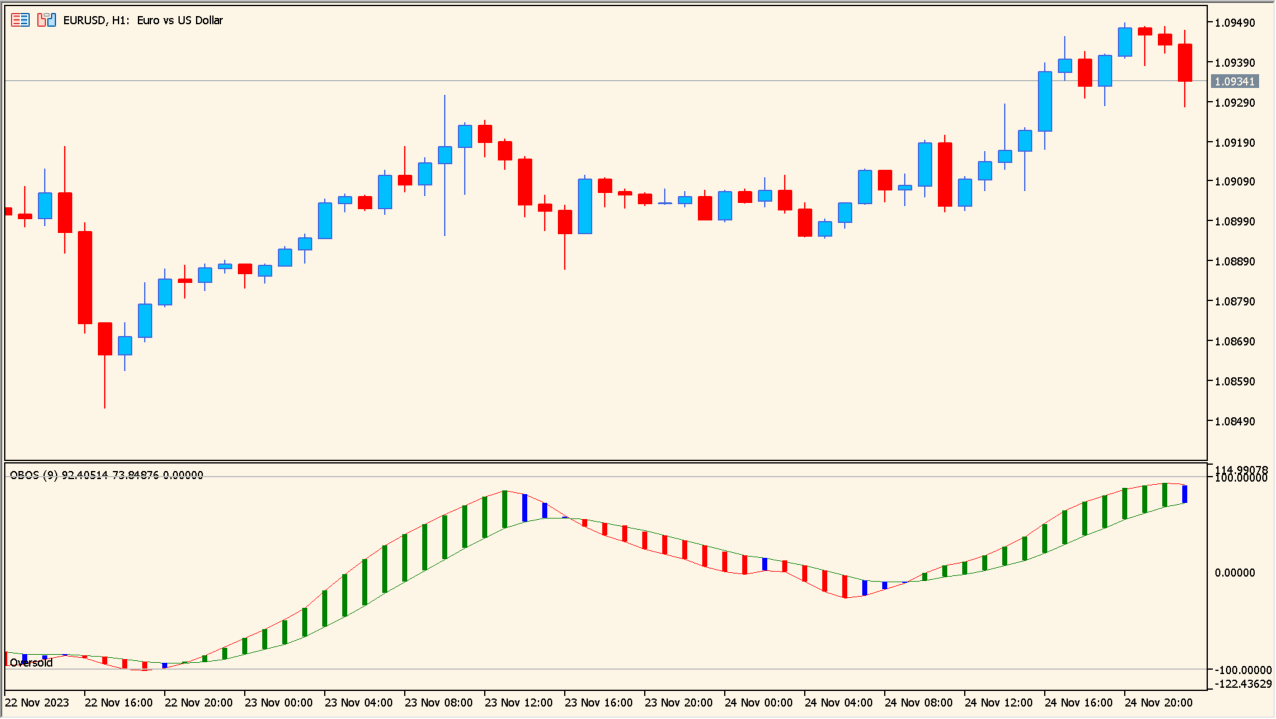
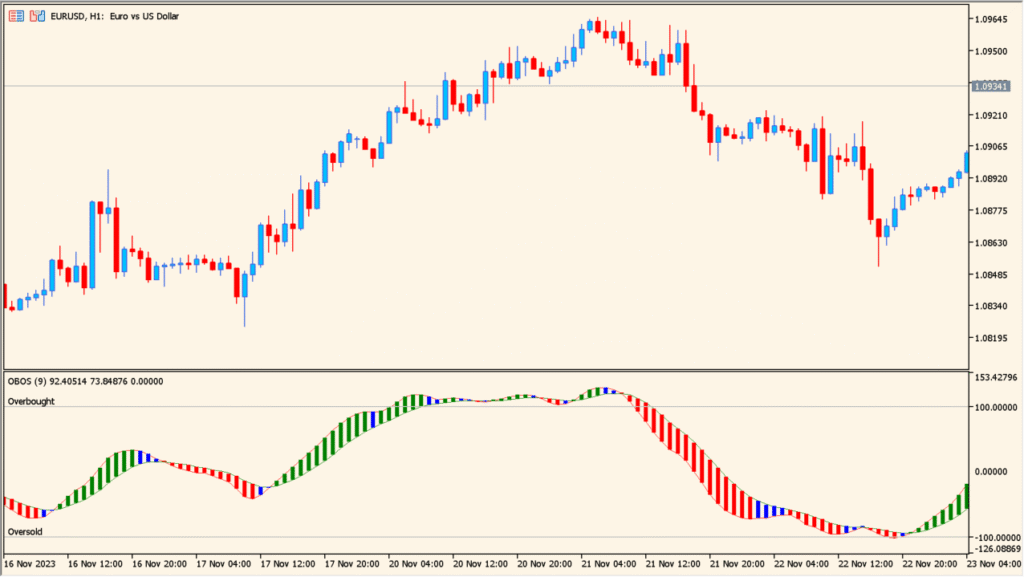
- Identify overbought conditions when the oscillator rises above the upper threshold.
- Spot oversold conditions when the line drops below the lower boundary.
- Observe momentum shifts when the histogram changes color or crosses the center value.
- Use momentum exhaustion signals as confirmation near support or resistance zones.
- Combine with trend indicators to filter counter-trend signals.
The indicator is most effective when used alongside price action or structure rather than as a standalone buy-sell tool.
Parameter Explanations
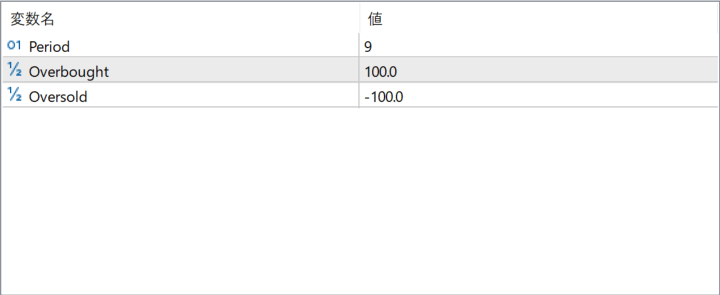
Period
Defines the calculation length of the oscillator. A shorter period makes the indicator more responsive, while a longer period smooths out noise.
Overbought
Sets the upper boundary of the indicator. Values above this level suggest the market may be stretched and potentially due for a slowdown or reversal.
Oversold
Sets the lower boundary. When the oscillator falls below this level, it indicates oversold conditions where buying pressure may soon return.