Overview of the OBOS Indicator
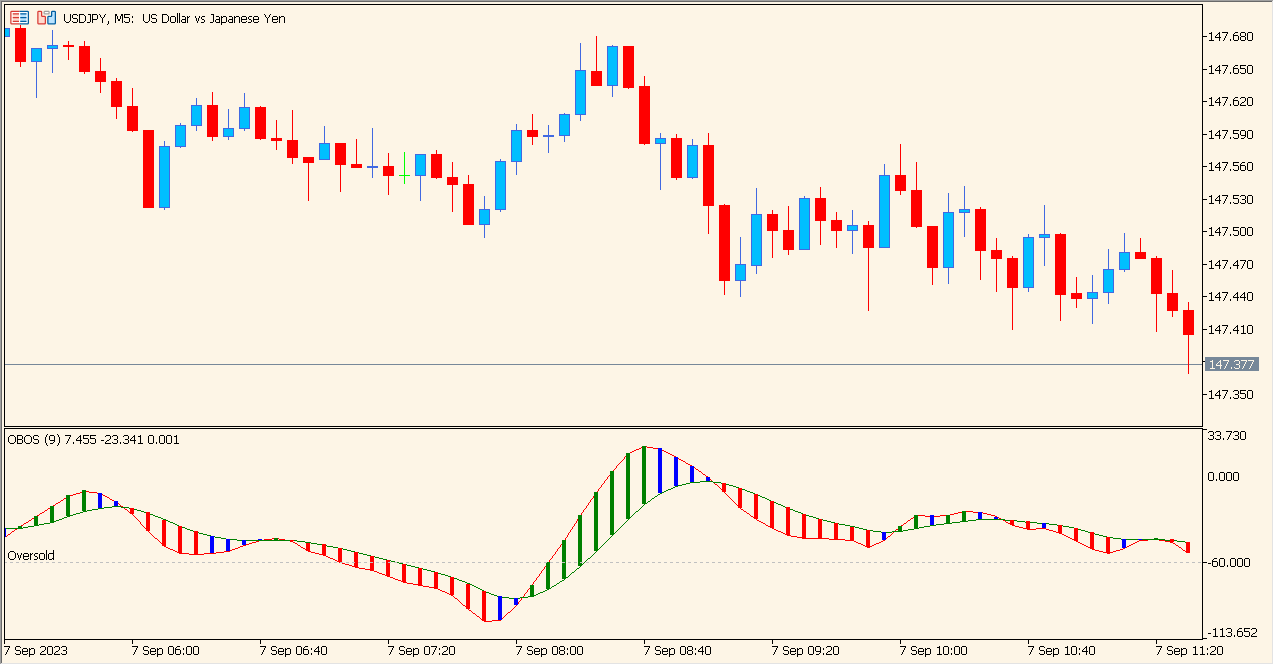
The OBOS indicator visualizes overbought and oversold market conditions using a smooth wave-style histogram. It highlights momentum shifts by coloring the histogram bars according to their direction, making it easy to spot when price pressure is turning bullish or bearish. The tool is straightforward and focuses purely on identifying stretched market conditions.
It calculates a transformed momentum value over a set period and compares it against upper and lower thresholds, helping traders quickly judge whether the market may be preparing for a reversal or continuation.
How to Use It in Practice
In live trading, you can use the OBOS indicator to:
- Identify potential reversal zones when the wave reaches overbought or oversold extremes.
- Confirm momentum direction by watching color changes on the histogram bars.
- Enhance entry timing when combined with trend tools or price action signals.
- Spot early shifts in momentum when the wave crosses above or below the zero line.
It works well for short-term scalping, intraday entries, or as a confirmation tool in larger trend setups.
Parameter Explanations
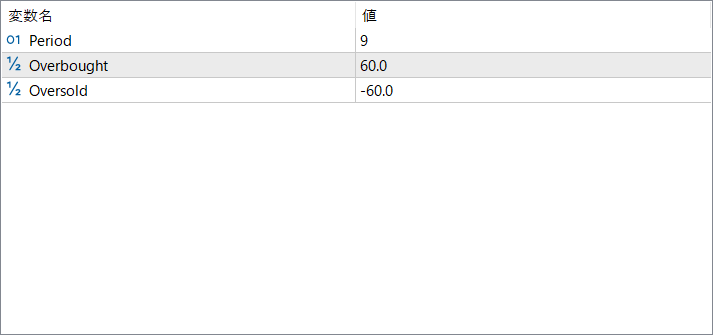
Period
Sets the number of bars used to calculate the indicator’s wave. Longer periods smooth the wave, while shorter ones make it more reactive.
Overbought
Defines the upper threshold at which the market is considered overbought. When the wave approaches or exceeds this level, momentum may be stretched to the upside.
Oversold
Defines the lower threshold marking oversold conditions. Reaching this zone may signal weakened bearish momentum or a possible upward reversal.