Overview of the PivotPoint Indicator
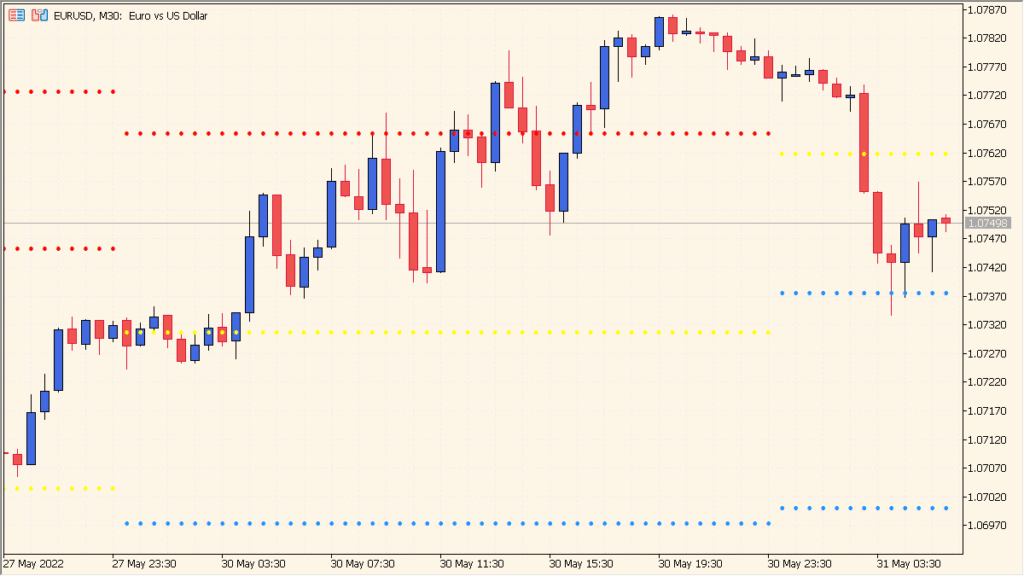
The PivotPoint indicator displays daily pivot levels based on the previous day’s price data. It calculates the main pivot point (P), along with three levels of support (S1–S3) and resistance (R1–R3). These levels act as potential turning points where the price may react, reverse, or continue its movement depending on market sentiment.
This indicator is useful for identifying key price zones for intraday trading. Many traders use it to determine potential entry and exit areas or to confirm trend strength during active market sessions.
How to Use It in Practice

In real trading, the PivotPoint indicator helps you to:
- Identify potential intraday support and resistance levels.
- Plan buy or sell entries near pivot levels when confirmed by price action.
- Use R1–R3 levels as take-profit targets and S1–S3 as potential reversal areas.
- Gauge market bias — trading above the pivot suggests bullish sentiment, while below indicates bearish conditions.
The indicator updates automatically each day and can be applied on any timeframe to see where price stands relative to the daily pivot structure.
Parameter Explanations

PivotPoint Calculation Period
Specifies the time period used for pivot calculations (e.g., Day, Week, or Month). Choosing “Day” calculates pivots based on the previous day’s high, low, and close, making it ideal for short-term trading. Weekly or monthly settings suit swing or position traders.