Indicator Overview
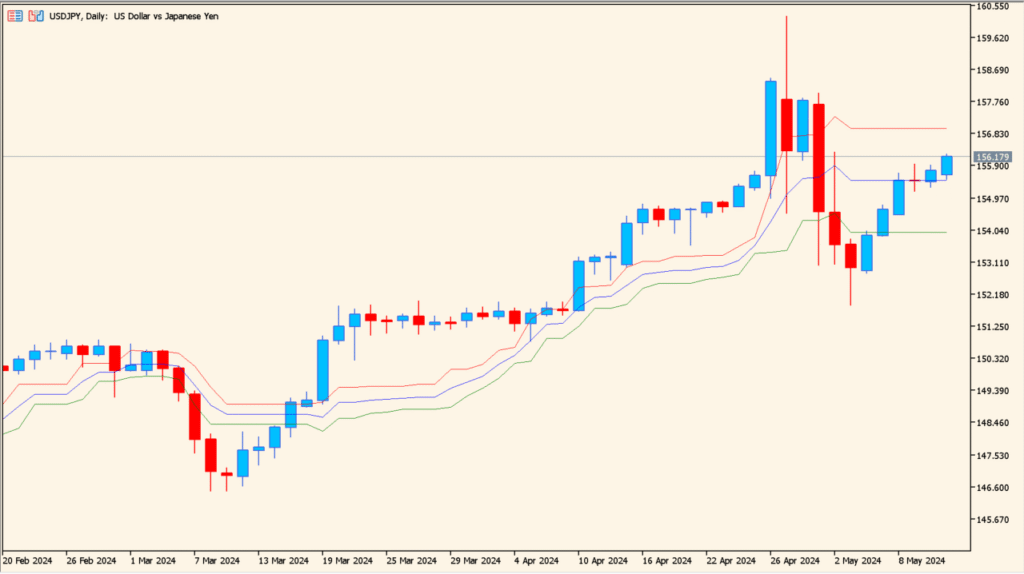
POB is a price-based band indicator that plots multiple dynamic lines around the current market price. These bands expand and contract with market movement, helping traders visually grasp short-term direction, balance, and volatility.
The indicator stays close to price action and reacts smoothly, making it useful for reading market structure rather than generating aggressive signals.
How to Use It in Practice

In practical trading, POB can be used to:
- Visualize short-term market balance and directional bias.
- Identify areas where price is stretching away from its recent range.
- Support mean-reversion or pullback-based entry decisions.
- Combine with trend or momentum indicators for confirmation.
POB works best as a visual filter. It helps clarify where price is relative to its recent structure, rather than acting as a standalone entry signal.
Parameter Explanations

Period
Defines the lookback length used to calculate the internal price bands. A shorter period reacts faster to price changes, while a longer period produces smoother and more stable bands.