Indicator Overview
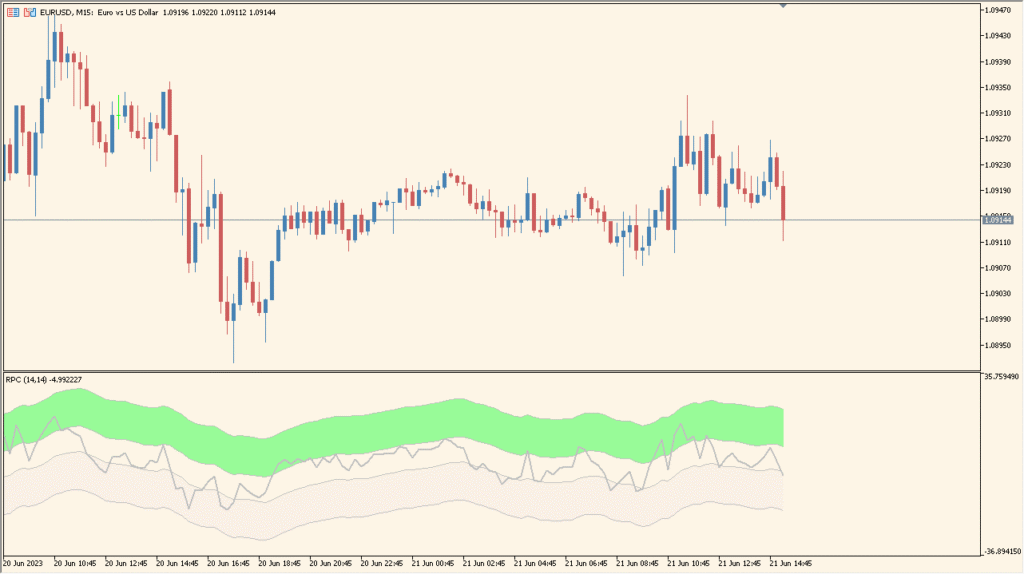
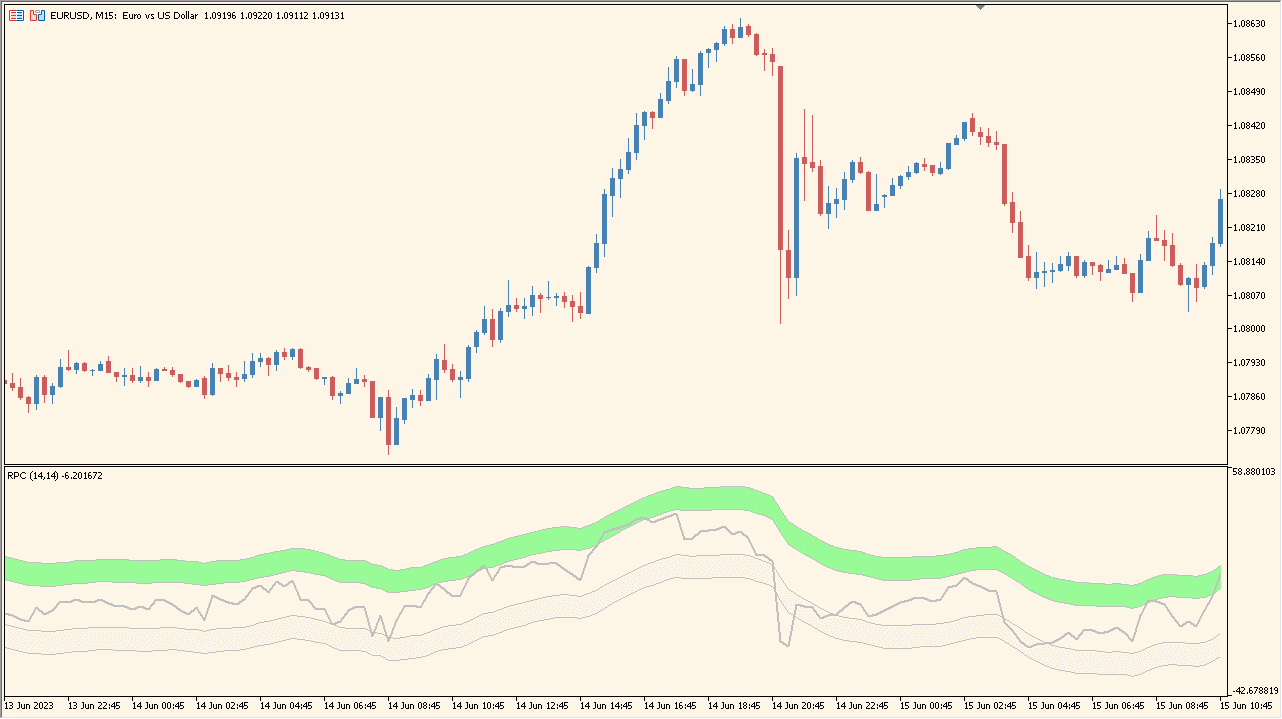
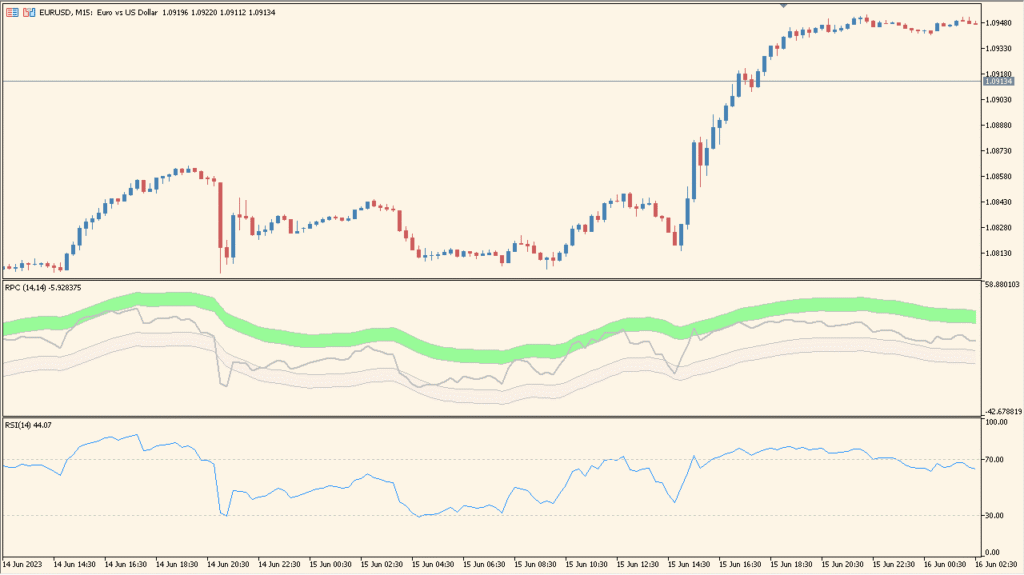
The Relative Price Channel indicator creates a channel based on RSI-derived values and plots it as a shaded band below the main chart. It visualizes relative price positioning by highlighting overbought, oversold, and neutral zones. This helps traders quickly understand whether the current price movement is leaning toward strength or weakness.
The tool converts RSI behavior into a channel-like structure, giving a more intuitive sense of momentum extremes without relying on the classic horizontal RSI chart layout.
How to Use It in Practice
In live trading, the Relative Price Channel can be used to:
- Check whether the current price action is entering overbought or oversold regions.
- Identify potential reversal points when the RSI-based channel reaches its extreme zones.
- Gauge momentum by observing how the channel behaves during trends or consolidations.
- Use the neutral band to understand when the market is lacking directional strength.
The smooth channel style makes it easier to monitor RSI-based momentum without switching focus to a separate oscillator window.
Parameter Explanations
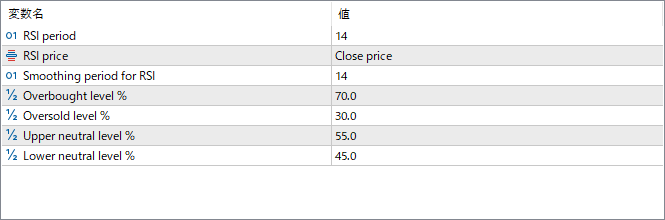
RSI period
Sets the number of bars used for RSI calculation. This controls the sensitivity of the channel movement.
RSI price
Specifies which price type is used for the RSI input, such as close or other price options.
Smoothing period for RSI
Defines the smoothing applied to the RSI output to create a more stable channel.
Overbought level %
Sets the percentage level where the channel marks conditions as overbought.
Oversold level %
Sets the percentage level where the channel marks conditions as oversold.
Upper neutral level %
Defines the upper boundary of the neutral zone, separating normal conditions from bullish pressure.
Lower neutral level %
Defines the lower boundary of the neutral zone, separating normal conditions from bearish pressure.