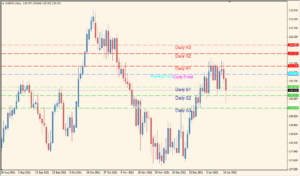
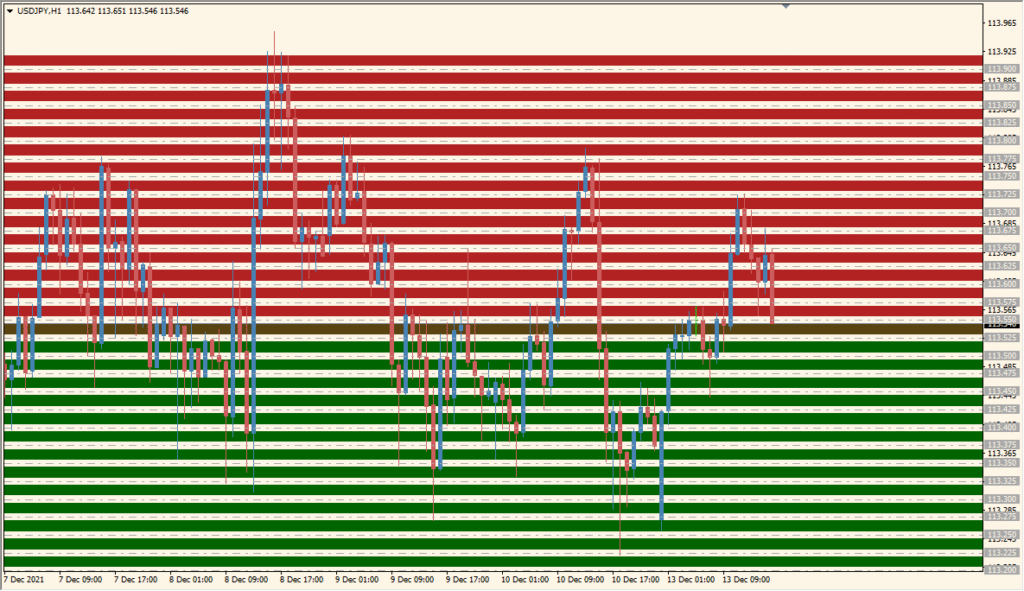
Overview of the RoundLevels Indicator
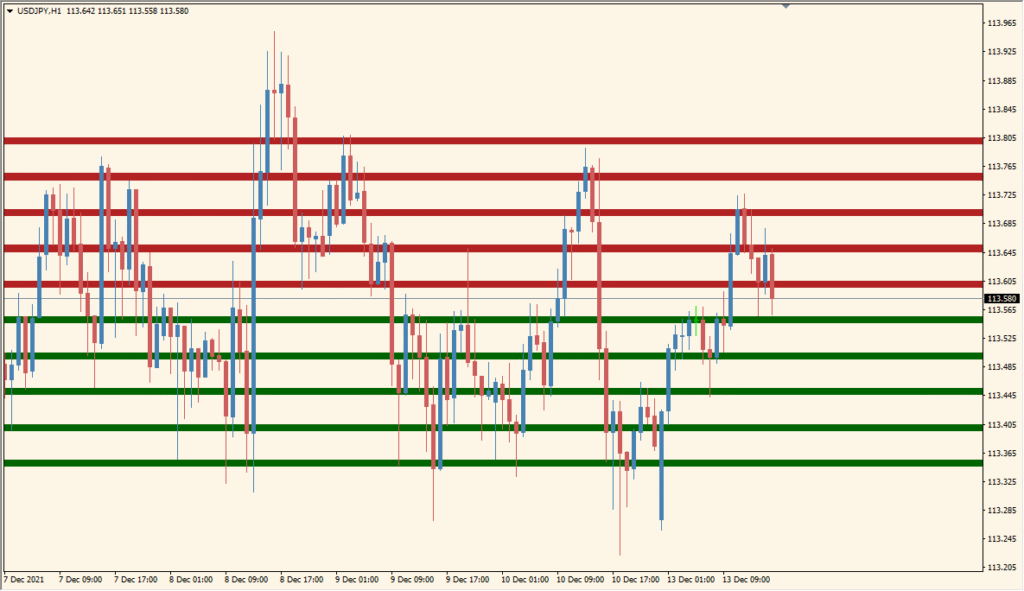
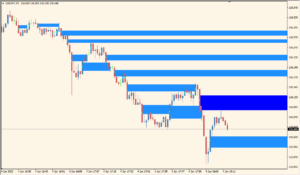
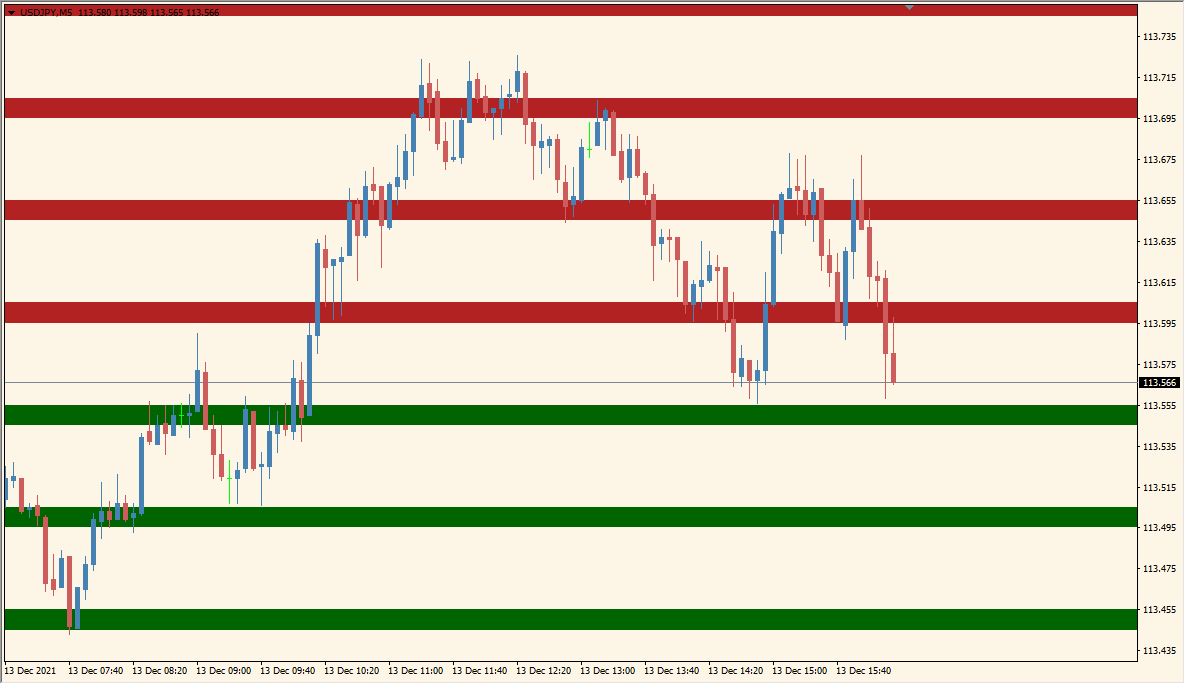
The RoundLevels indicator plots horizontal price zones based on fixed intervals, helping traders quickly visualize significant support and resistance areas. These levels are often aligned with round numbers, which tend to act as psychological price barriers in the market. By marking multiple zones above and below the current price, the indicator provides a structured view of price action boundaries.
This tool is especially useful for traders who rely on round numbers or want a visual guide for potential reaction zones. It draws colored bands and optionally lines to mark the price regions clearly.
How to Use It in Practice
In real-time trading, you can use the RoundLevels indicator to:
- Identify areas where price might reverse or stall based on round-number proximity.
- Plan entries, exits, or stop-loss placements around major support/resistance levels.
- Enhance other technical setups by providing structure to the chart.
- Use the visual zones as confluence areas when combined with trendlines, indicators, or price patterns.
The simplicity and clarity of this indicator make it suitable for scalpers, day traders, and swing traders alike.
Parameter Explanations
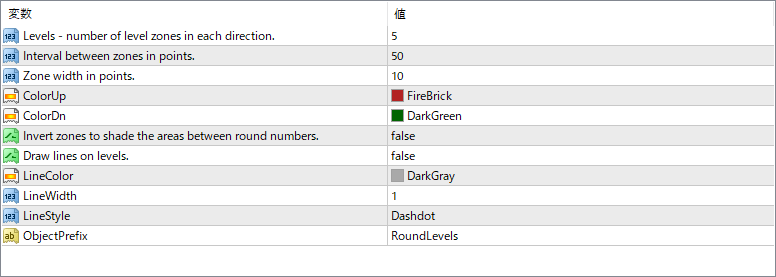
Levels – number of level zones in each direction
Specifies how many zones are drawn above and below the current price.
Interval between zones in points
Sets the spacing between each level zone. Smaller values create denser levels, while larger values create more spaced zones.
Zone width in points
Defines the vertical size of each highlighted zone.
ColorUp
Sets the color used for zones above the current price.
ColorDn
Sets the color used for zones below the current price.
Invert zones to shade the areas between lines
If enabled, it reverses the shading logic to fill gaps between levels instead of fixed width zones.
Draw lines on levels
If true, lines will be drawn at each level for added clarity in addition to the shaded zones.
LineColor
Sets the color of the lines drawn on each level.
LineWidth
Controls the thickness of the level lines.
LineStyle
Defines the line pattern, such as solid, dotted, or dashdot.
ObjectPrefix
Applies a prefix to all objects created by the indicator to avoid conflicts with other tools or scripts.