Overview of the RoundLevels Indicator

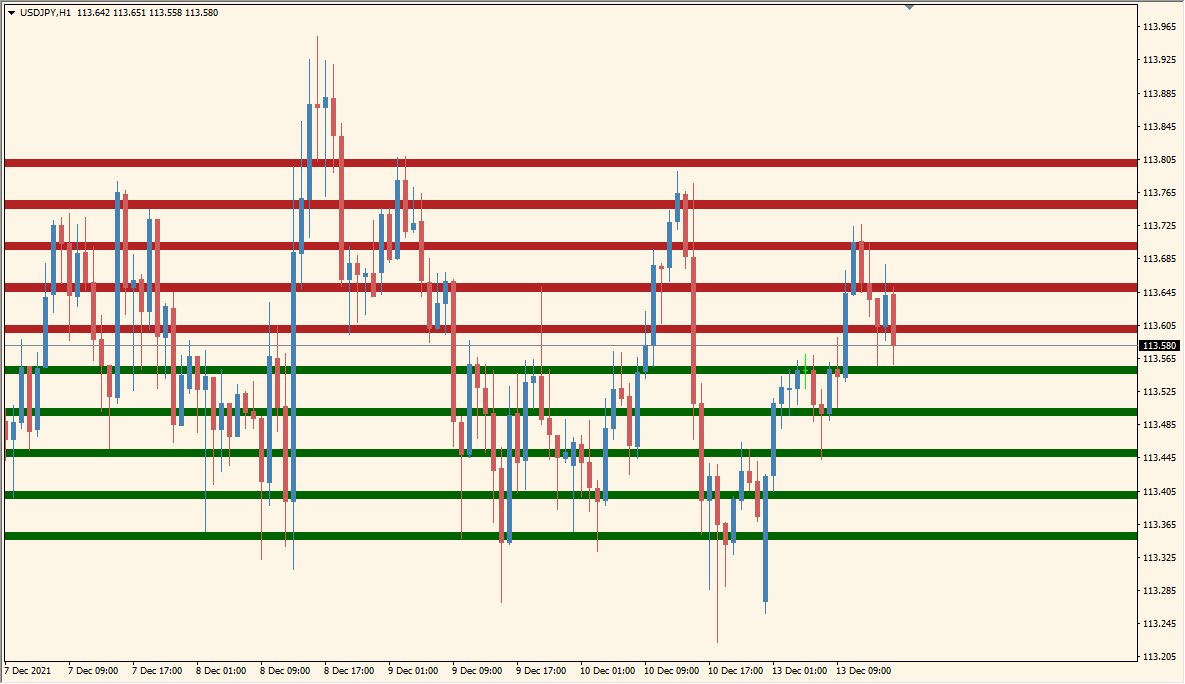
The RoundLevels indicator for MT4 automatically plots horizontal zones around significant round number levels on the chart. These zones often act as psychological support and resistance areas where traders expect price reactions. The indicator visually separates these areas with colored bands, making it easier to spot potential reversal or breakout zones.
By using color-coded regions (for example, red for upper zones and green for lower ones), RoundLevels helps traders quickly identify critical price levels without manually drawing lines. This tool is particularly helpful for those who rely on round numbers as part of their technical strategy.
How to Use It in Practice
In practice, RoundLevels can be used to identify potential reaction areas where price might stall, reverse, or break through. Many traders combine it with oscillators or price action confirmation to time entries and exits more accurately.
- Use the colored zones as dynamic support and resistance areas.
- Watch for price consolidations near red or green bands before potential breakouts.
- Combine with volume or trend indicators for stronger trade confirmation.
- Adjust the interval and zone width to match your trading timeframe and instrument volatility.
The indicator works well for both intraday and swing traders who prefer visually clear support and resistance structures directly on their charts.
Parameter Explanations
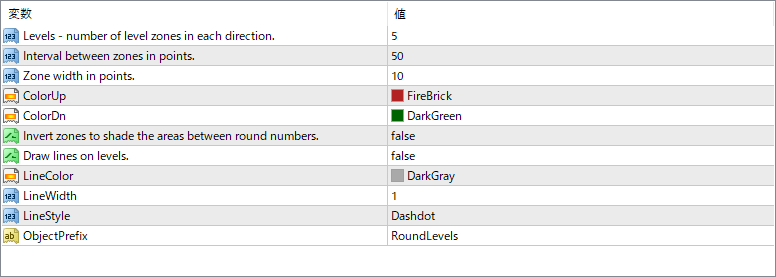
Levels
Specifies how many upper and lower level zones are displayed from the current price. Adjusting this increases or decreases the number of visible zones.
Interval between zones in points
Defines the distance (in points) between each zone. A smaller interval will create denser zones, while a larger value spaces them out more widely.
Zone width in points
Determines how thick each zone appears on the chart. Wider zones create broader visual areas for potential support/resistance.
ColorUp
Sets the color of the upper zones, which typically represent potential resistance levels above the current price.
ColorDn
Sets the color of the lower zones, generally representing potential support levels below the current price.
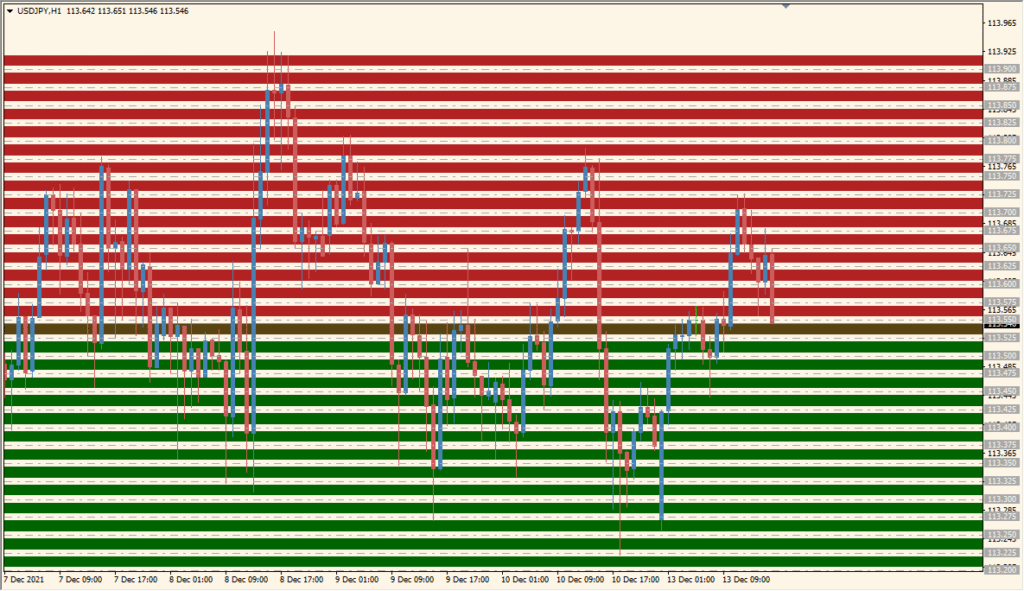
Invert zones to shade the areas between
When enabled, the indicator shades the spaces between zones instead of the zones themselves, changing the visual layout of support and resistance areas.
Draw lines on levels
Enables or disables drawing thin lines at the center of each zone, useful if you prefer line-based instead of filled zone visuals.
LineColor
Specifies the color of the lines drawn at each level (if line drawing is enabled).
LineWidth
Defines the thickness of the horizontal lines drawn at each level.
LineStyle
Selects the style of the line — for example, solid, dashed, or dash-dot — to match your chart preferences.
ObjectPrefix
Determines the prefix used for naming objects the indicator draws, useful for organizing or deleting them later.