Overview of the RSI Slope Divergence Indicator
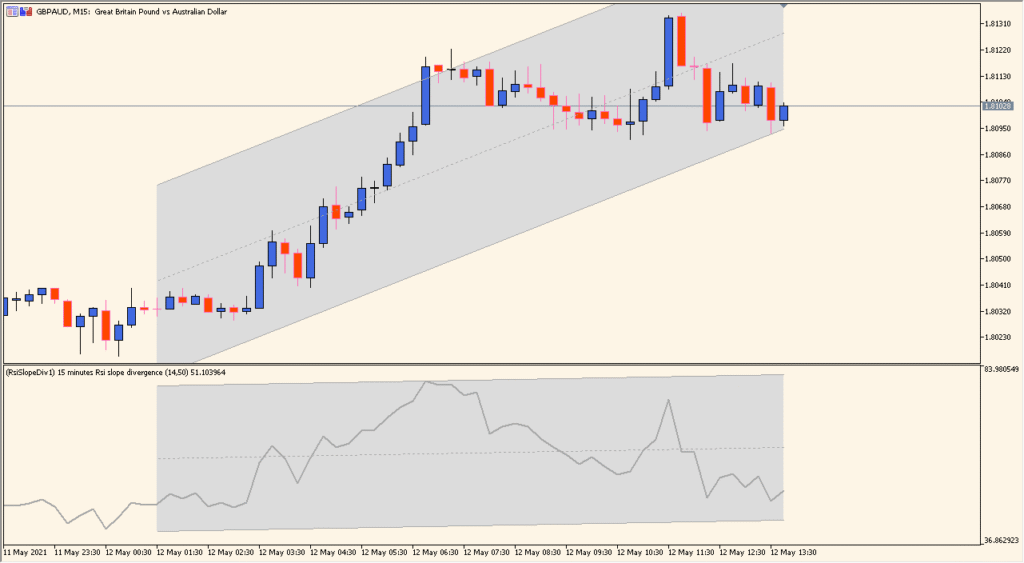
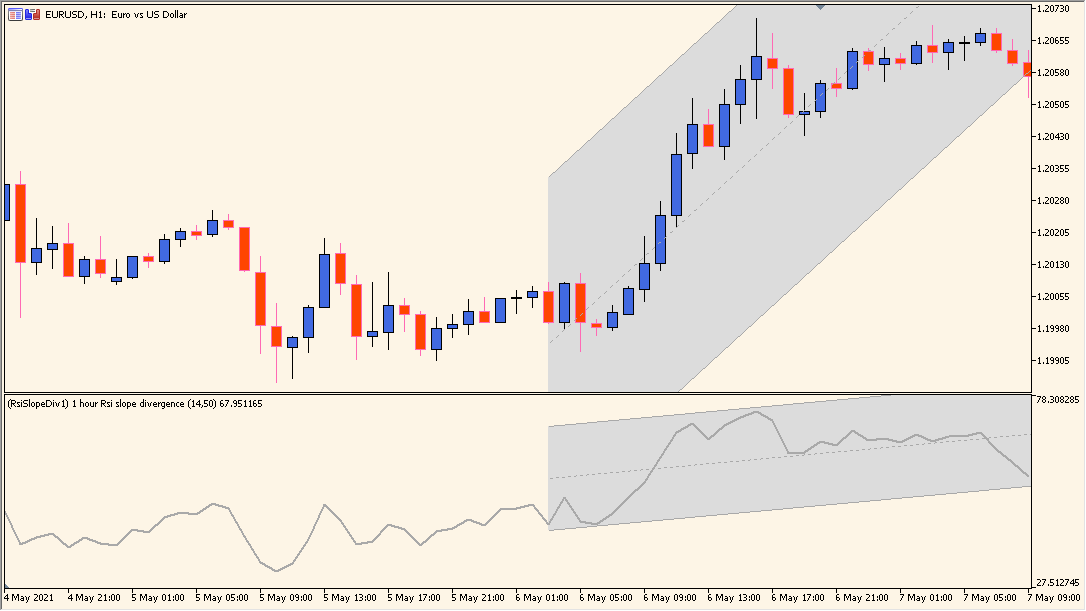
The RSI Slope Divergence Indicator for MT4 combines RSI slope analysis with a linear regression channel to highlight potential divergence signals. It displays both price and RSI channels on the chart, making it easier to spot when price movement and momentum are out of sync. This visual approach can help traders identify possible trend reversals or continuation setups.
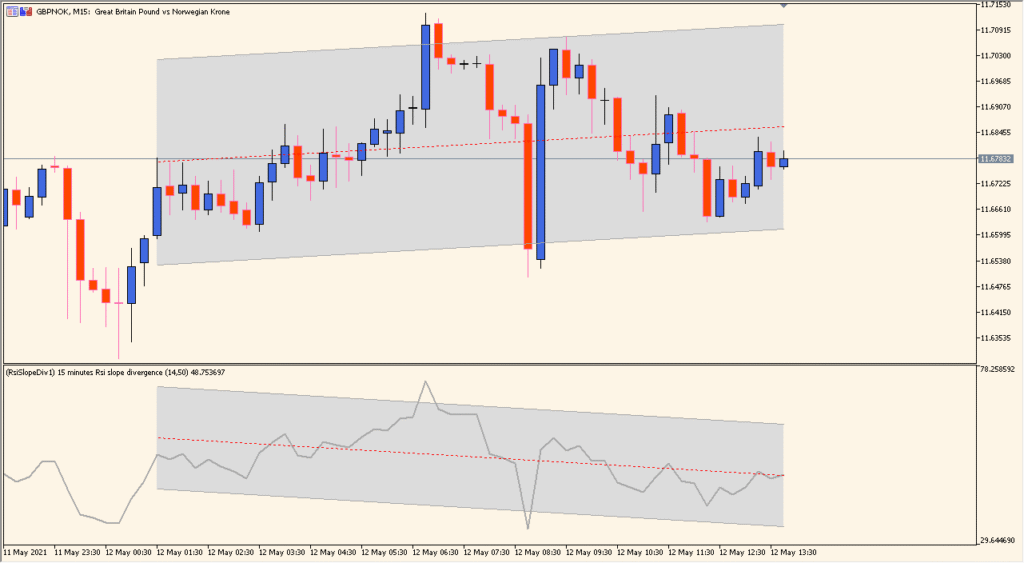
The indicator works by plotting linear regression channels on both the main price chart and the RSI subwindow. Divergence signals are marked when the slope direction of price and RSI differ, giving traders an early warning of potential shifts in market sentiment.
How to Use It in Practice
In practical trading, this indicator can be used to:
- Identify bullish or bearish divergence between price and RSI.
- Spot potential trend reversals before they occur.
- Use the linear regression channel as dynamic support and resistance.
- Filter trades by waiting for divergence confirmation before entry.
This makes it suitable for traders who combine price action with momentum analysis and prefer clear visual cues for divergence spotting.
Parameter Explanations
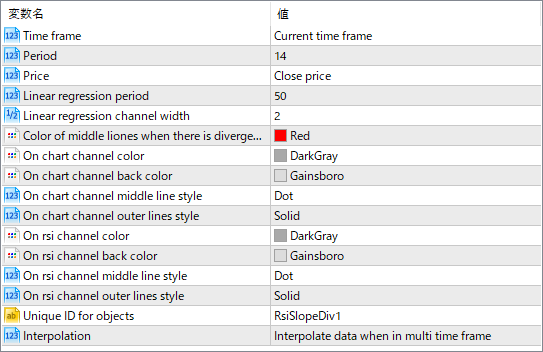
Time frame
Sets the timeframe used for calculation. Can be the current chart timeframe or a higher/lower one for multi-timeframe analysis.
Period
Number of periods used to calculate the RSI.
Price
Selects the price type (e.g., close price) used for calculations.
Linear regression period
Defines the number of bars used to build the linear regression channel.
Linear regression channel width
Controls the distance from the central regression line to the channel boundaries.
Color of middle lines when there is divergence
Sets the color of the middle line in the channel when a divergence signal is detected.
On chart channel color
Defines the color of the price chart channel lines.
On chart channel back color
Sets the background color of the price chart channel area.
On chart channel middle line style
Specifies the line style (e.g., dotted) for the channel’s middle line on the chart.
On chart channel outer lines style
Specifies the line style for the channel’s outer boundaries on the chart.
On RSI channel color
Defines the color of the RSI channel lines.
On RSI channel back color
Sets the background color of the RSI channel area.
On RSI channel middle line style
Specifies the line style for the RSI channel’s middle line.
On RSI channel outer lines style
Specifies the line style for the RSI channel’s outer boundaries.
Unique ID for objects
Identifier used to manage and distinguish indicator objects on the chart.
Interpolation
Determines whether data is interpolated when using multi-timeframe mode.