Overview of the Set Of Averages Indicator

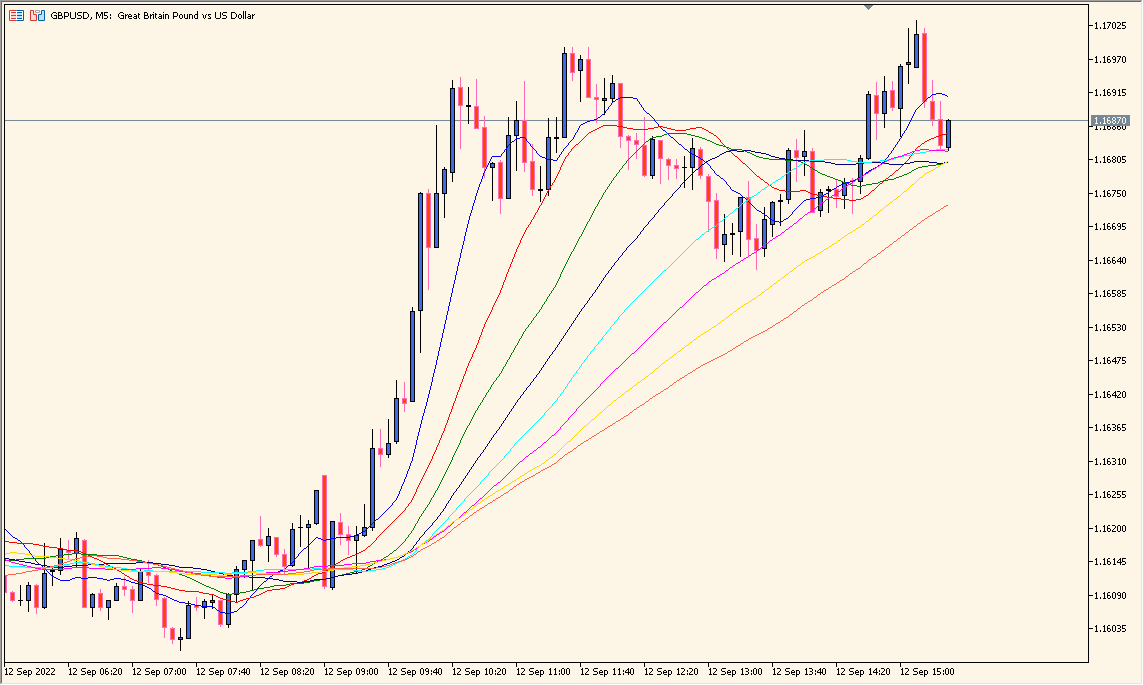
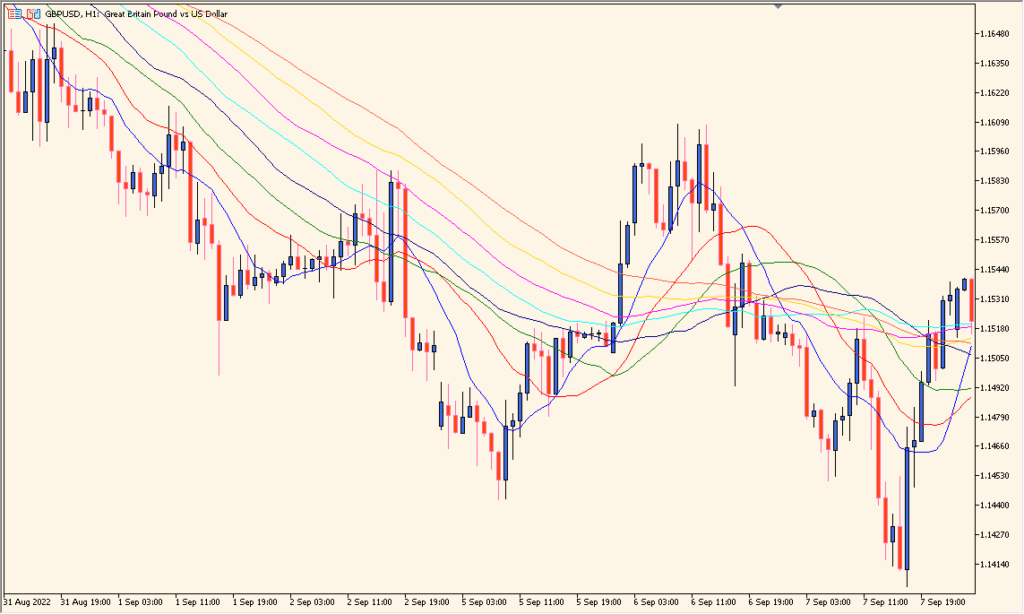
The Set Of Averages indicator displays multiple moving averages on a single chart, providing a clear view of market trends and momentum. Each moving average is calculated with different periods, helping traders visualize short-, medium-, and long-term price movements simultaneously.
This tool is useful for identifying overall market direction, spotting trend reversals, and analyzing price alignment across multiple moving averages. It simplifies the process of comparing various time-based averages in one view.
How to Use It in Practice
In live trading, the Set Of Averages indicator can be applied to:
- Confirm overall trend direction based on the alignment of multiple MAs.
- Spot crossover signals between short and long MAs as potential entry or exit points.
- Determine support or resistance zones using groups of moving averages.
- Filter trades according to the trend strength indicated by MA spacing.
When the MAs are stacked in order (e.g., 10 above 20, 20 above 30, etc.), it indicates a strong trend. When they begin to cross or converge, it may suggest a possible reversal or consolidation phase.
Parameter Explanations
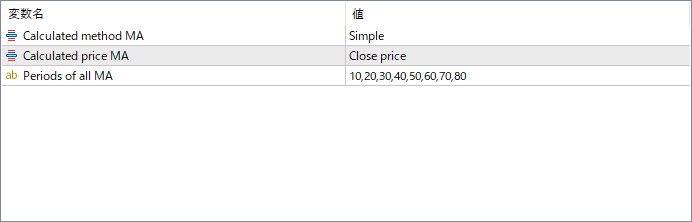
Calculated method MA
Specifies the type of moving average to be used, such as Simple, Exponential, or Smoothed. This determines how each average is calculated based on past price data.
Calculated price MA
Defines which price point is used in the MA calculation, such as Close, Open, High, or Low prices.
Periods of all MA
Lists the periods for each moving average, separated by commas. Each value represents a different MA line plotted on the chart. For example, “10,20,30…” means MAs of 10, 20, and 30 periods are displayed together.