Overview of the Shved Supply and Demand Indicator
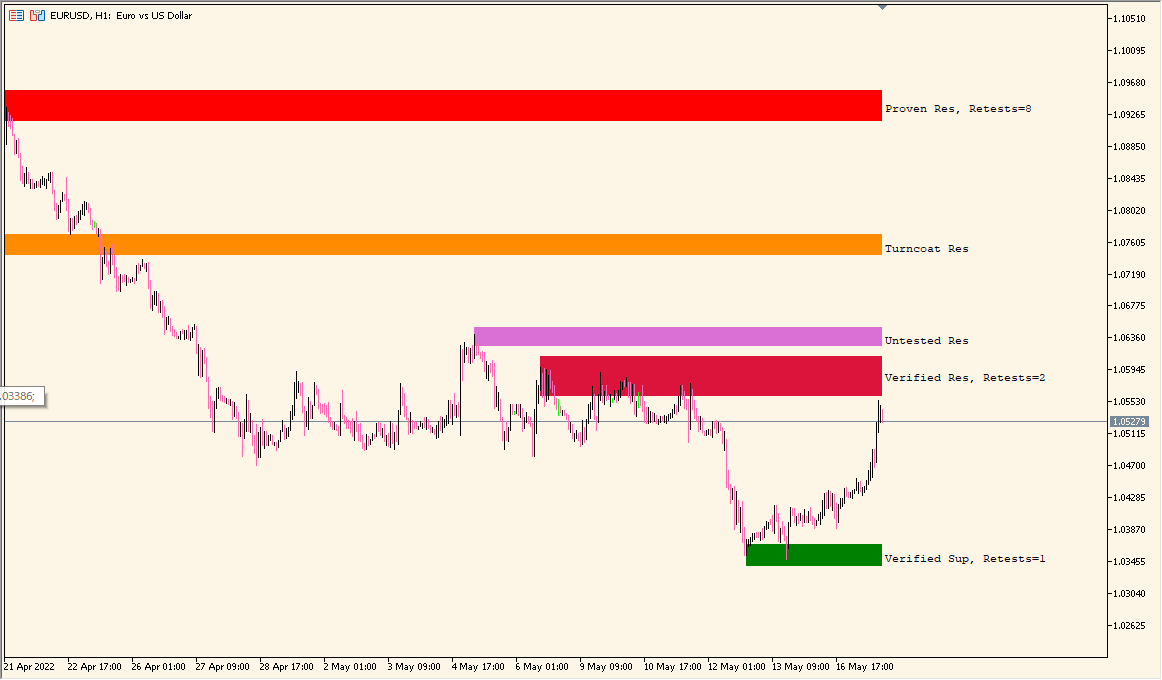
The Shved Supply and Demand indicator automatically detects supply and demand zones on the chart. It identifies areas where price has shown strong movement before, marking them as potential zones of interest for future reversals or breakouts. The zones are color-coded, making it easy to distinguish between supply (resistance) and demand (support) areas at a glance.
This indicator helps traders visualize institutional activity areas and key price levels where imbalances between buyers and sellers previously occurred. It is especially useful for traders who use price action or zone-based trading strategies.
How to Use It in Practice
In practice, traders can use this indicator to identify potential reversal or continuation points. When price approaches a marked supply or demand zone, traders can observe price action behavior to confirm possible entries or exits. Untested and broken zones help understand market structure and strength of each area.
- Watch for price reactions when it reaches the highlighted zones.
- Use “untested” zones to anticipate fresh reactions.
- Combine with candlestick patterns or volume analysis for confirmation.
- Avoid trading directly inside “broken” zones as they may no longer be valid.
By combining this indicator with proper risk management, traders can improve their decision-making when identifying key areas of supply and demand imbalance.
Parameter Explanations
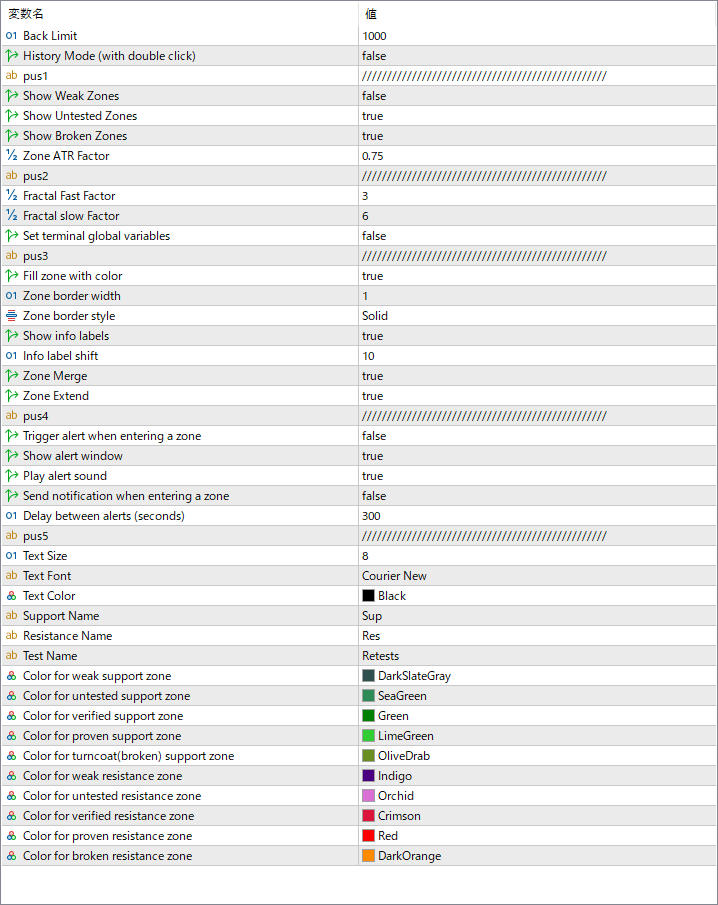
Back Limit
Sets how many historical bars the indicator analyzes to detect zones. Increasing the number may reveal more past zones but can slow down processing.
History Mode (with double click)
Allows manual review of historical zones by double-clicking on the chart to toggle through past data.
Show Weak Zones
Displays weaker zones that have already been tested multiple times. Useful for studying price behavior but less reliable for trading signals.
Show Untested Zones
Displays zones that have not yet been retested by price, offering higher probability setups for reversals.
Show Broken Zones
Shows zones that have already failed, helping traders visualize changes in market structure.
Zone ATR Factor
Defines how the zone height is adjusted based on market volatility. A higher factor expands the zone width relative to the ATR (Average True Range).
Fractal Fast Factor / Fractal Slow Factor
Control the sensitivity of the fractal algorithm used for detecting significant swing highs and lows that define zones.
Fill zone with color
Enables or disables background coloring of zones for easier visualization.
Zone border width / style
Adjusts the thickness and line style of the zone borders for better chart clarity.
Show info labels
Displays labels indicating whether the zone is verified, retested, or broken, along with retest counts.
Zone Merge
Merges nearby overlapping zones into one larger zone to reduce clutter.
Trigger alert when entering a zone
Activates alerts when price enters a marked supply or demand area.
Play alert sound
Plays an audible sound when an alert condition is met.
Send notification when entering a zone
Sends a push notification to your connected device when the price reaches a zone.
Delay between alerts (seconds)
Specifies how long to wait before triggering the next alert to prevent excessive notifications.