Overview of the Indicator
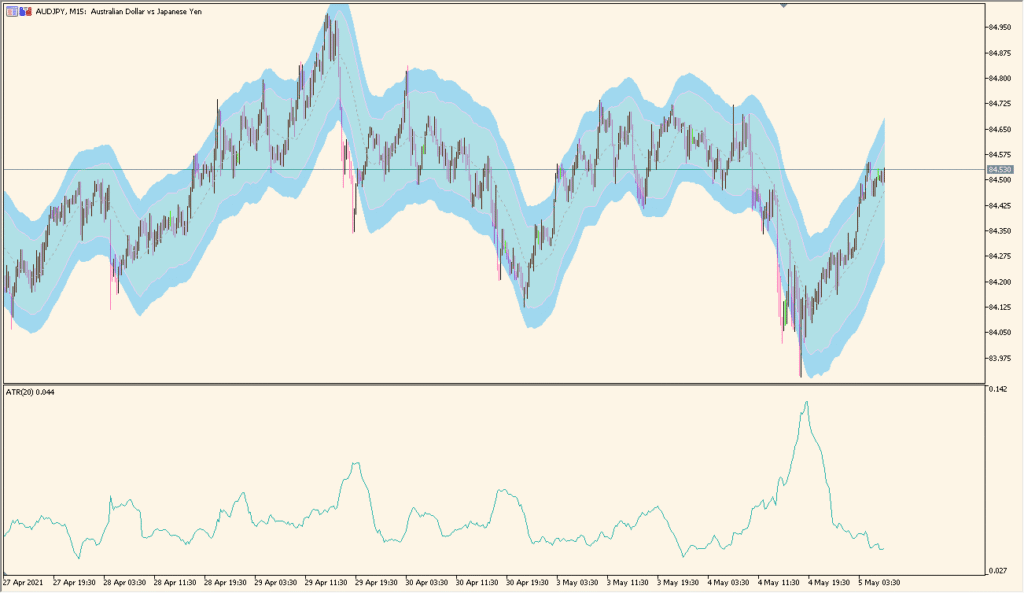
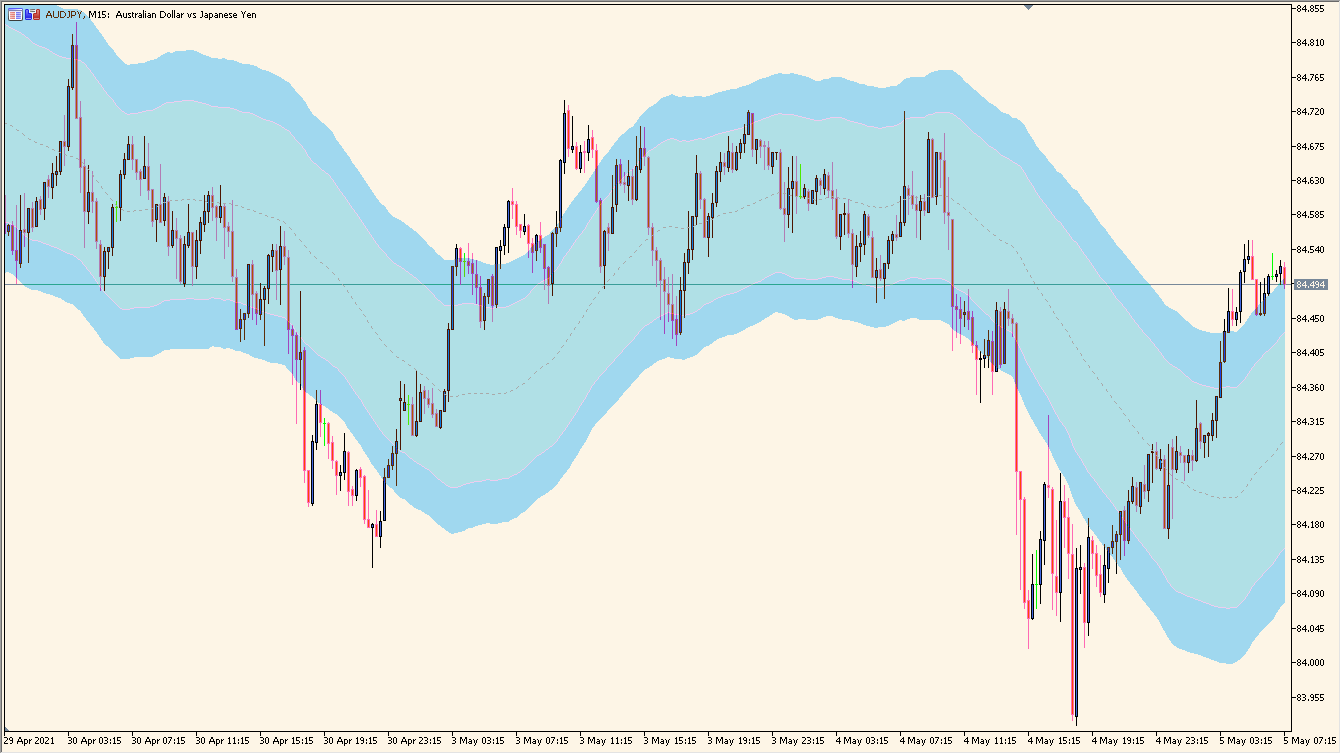
STARC Band is a volatility-based channel indicator that plots upper and lower bands around a moving average. The bands are calculated using the Average True Range (ATR), which means they automatically expand during high volatility and contract during quiet market conditions.
Unlike fixed-width channels, STARC Bands adjust to current market activity. This makes them useful for identifying overextended price moves, dynamic support and resistance, and potential mean reversion areas.
How to Use It in Practice

When price touches or moves outside the upper band, it suggests that the market may be temporarily overbought. When price reaches the lower band, it may indicate short-term oversold conditions. These areas can be used to look for pullbacks or reversals.
In trending markets, price can ride along one band for some time. In such cases, the bands help measure trend strength rather than signal immediate reversal. Combining STARC Bands with trend confirmation tools improves reliability.
Parameter Explanations
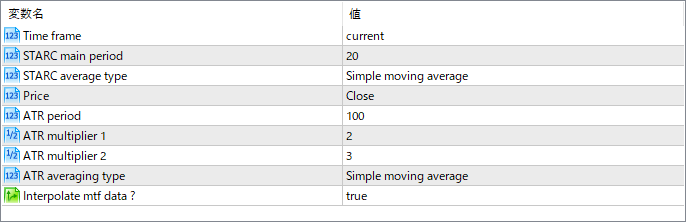
Time frame
Defines the timeframe used for the band calculation. It can follow the current chart timeframe or use a higher timeframe for broader analysis.
STARC main period
Sets the period of the moving average that forms the center line of the bands. A larger value smooths the center line, while a smaller value reacts faster to price changes.
STARC average type
Specifies the type of moving average used for the center line, such as simple or other averaging methods.
Price
Determines which price type is used in the calculation, such as Close, Open, High, or Low.
ATR period
Defines the period used to calculate the Average True Range, which controls how sensitive the bands are to volatility changes.
ATR multiplier 1
Sets the multiplier applied to the ATR for the first band distance from the center line.
ATR multiplier 2
Sets the multiplier for the second band distance, allowing wider outer bands for extreme conditions.
ATR averaging type
Specifies the averaging method used in the ATR calculation.
Interpolate mtf data ?
Controls whether higher timeframe data is interpolated to align smoothly with the current chart when multi-timeframe analysis is enabled.