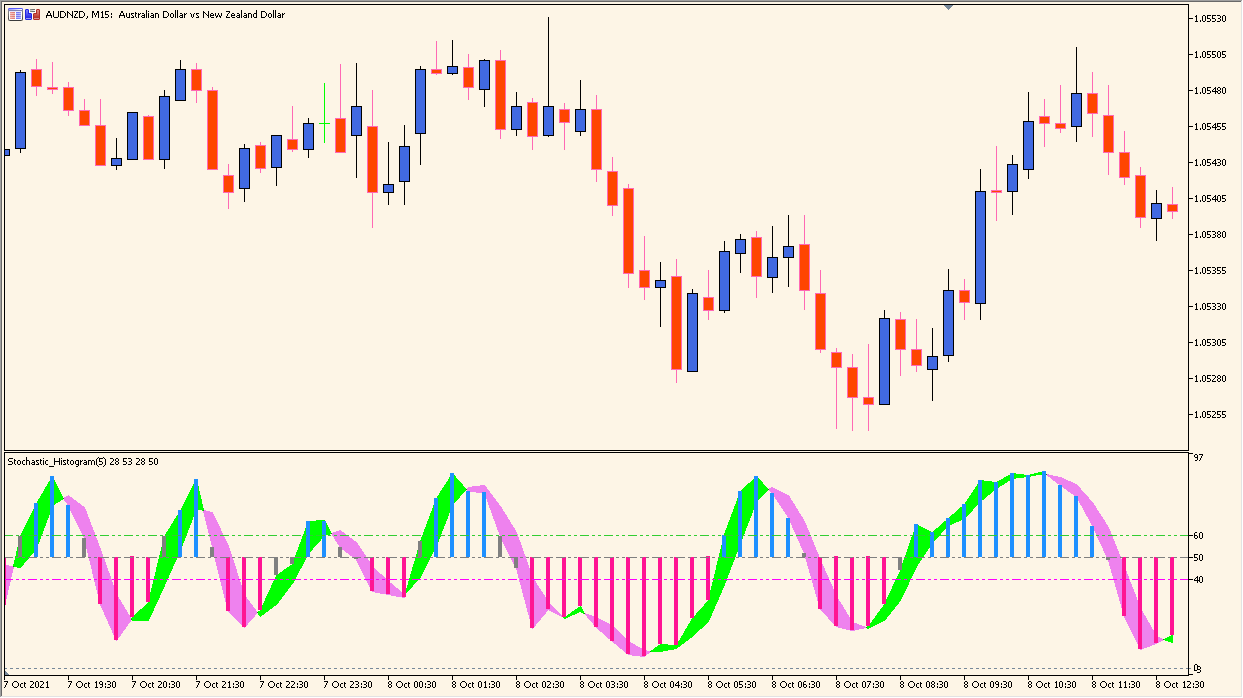
Overview of the Stochastic Histogram Indicator
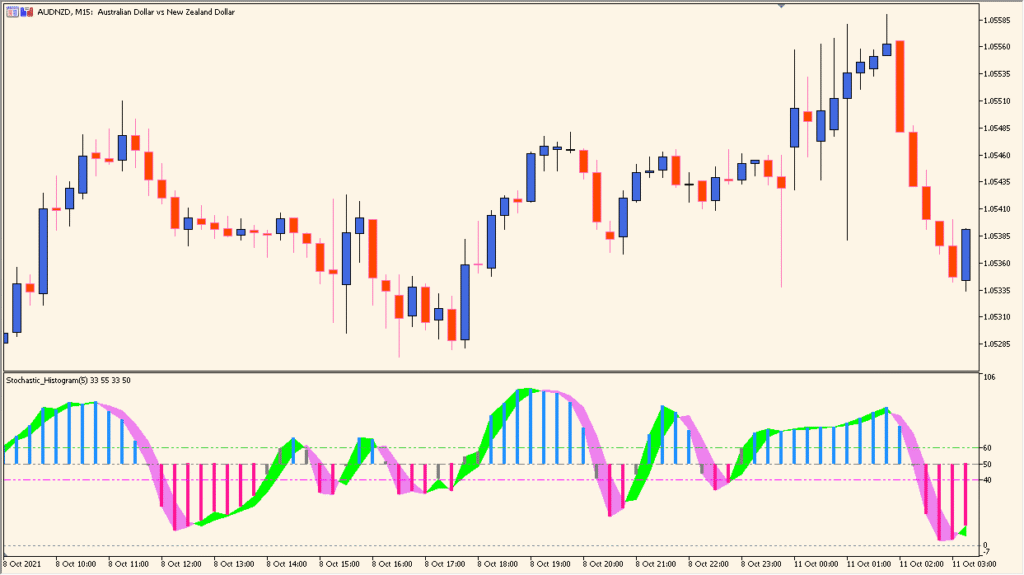
The Stochastic Histogram indicator for MT4 transforms the traditional Stochastic Oscillator into a color-coded histogram format. This makes it easier to visualize overbought and oversold zones as well as the strength of momentum. The histogram bars represent the difference between the %K and %D lines, helping traders identify shifts in market momentum more clearly than with standard line-based displays.
By highlighting momentum changes visually, this indicator allows traders to quickly detect potential reversals or continuation signals in a simple and intuitive way.
How to Use It in Practice
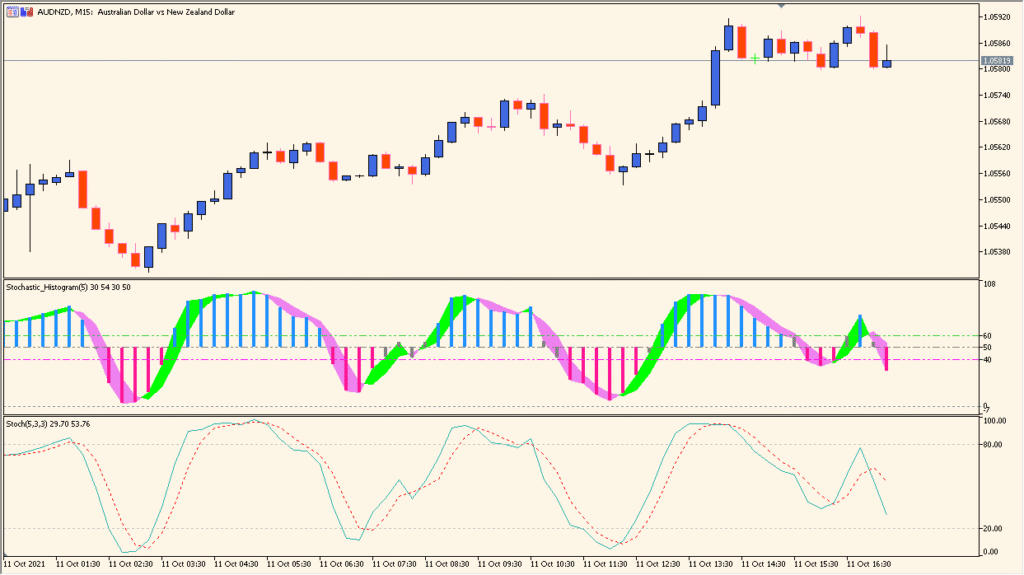
In practice, the Stochastic Histogram can be used to spot market turning points and confirm trend strength:
- When histogram bars turn positive (above the zero line), it indicates bullish momentum.
- When bars turn negative, it signals bearish momentum.
- The transition between colors often marks momentum shifts that precede price reversals.
- Use the HighLevel and LowLevel lines (commonly 60 and 40) to identify overbought or oversold conditions.
This indicator is especially useful for traders who prefer momentum-based entries or want to confirm other oscillators’ signals visually.
Parameter Explanations
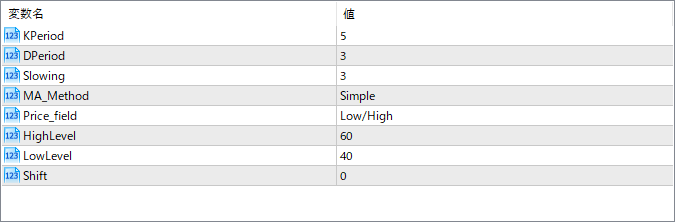
KPeriod
Defines the number of periods used to calculate the %K line. Shorter values make the indicator more responsive, while longer ones smooth out fluctuations.
DPeriod
Specifies the smoothing period for the %D line, which is the moving average of %K. It helps filter out noise from short-term movements.
Slowing
Applies additional smoothing to the %K calculation, reducing volatility and making signals more reliable.
MA_Method
Determines the moving average type used in the calculation (e.g., Simple, Exponential). This affects how responsive the smoothing will be.
Price_field
Sets which price values are used for calculations (e.g., Low/High or Close/Close). This influences how the oscillator reacts to market movements.
HighLevel
Defines the upper boundary level, often used as an overbought threshold where prices may start to reverse downward.
LowLevel
Defines the lower boundary level, representing the oversold zone where potential upward reversals might occur.
Shift
Moves the indicator forward or backward on the chart by a specified number of bars. Useful for visual alignment or testing.