Overview of the Indicator
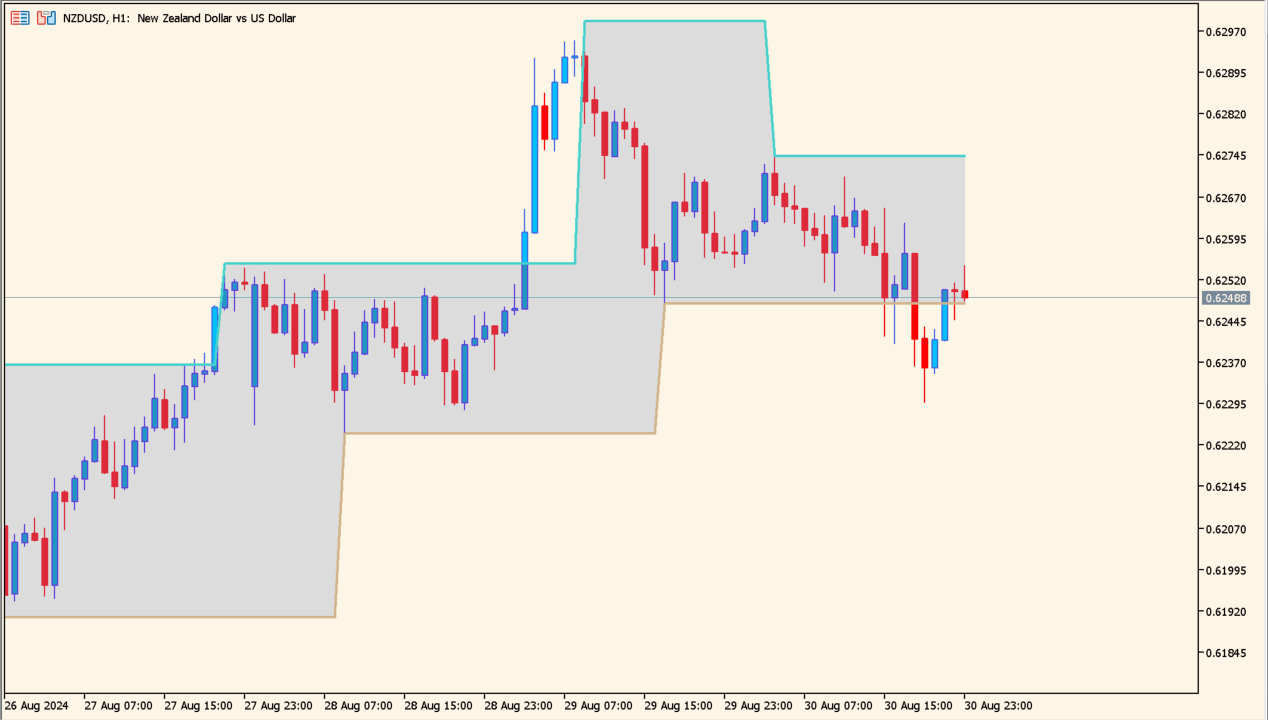
Support_and_Resistance_-_barry is a structure-based indicator that automatically identifies and draws support and resistance zones using fractal logic. It scans recent price action, detects swing highs and lows, and projects horizontal areas where price previously reacted.
Instead of relying on manually drawn lines, the indicator highlights price zones where supply and demand have been active. These zones help traders quickly see potential reaction levels on the chart.
How to Use It in Practice
When price approaches a highlighted resistance zone from below, traders can watch for rejection signals or weakening momentum. When price moves into a support zone from above, it may offer potential bounce opportunities.
If a zone is clearly broken with strong momentum, it can later act as a role-reversal level. This makes the indicator useful for breakout trading as well as range-based strategies.
Parameters
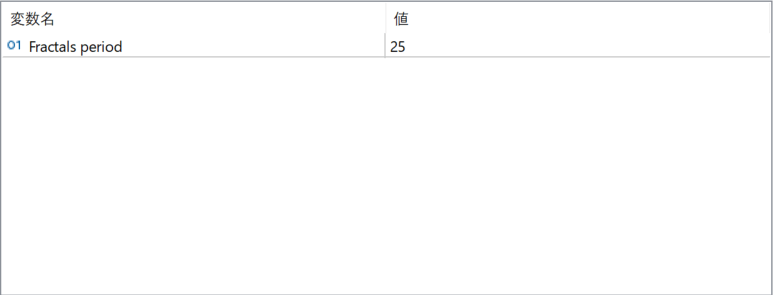
Fractals period
Defines how many bars are used to detect swing highs and swing lows. A smaller value produces more frequent zones, while a larger value filters out minor swings and focuses on stronger structural levels.