Overview of the Symbol Movement Indicator
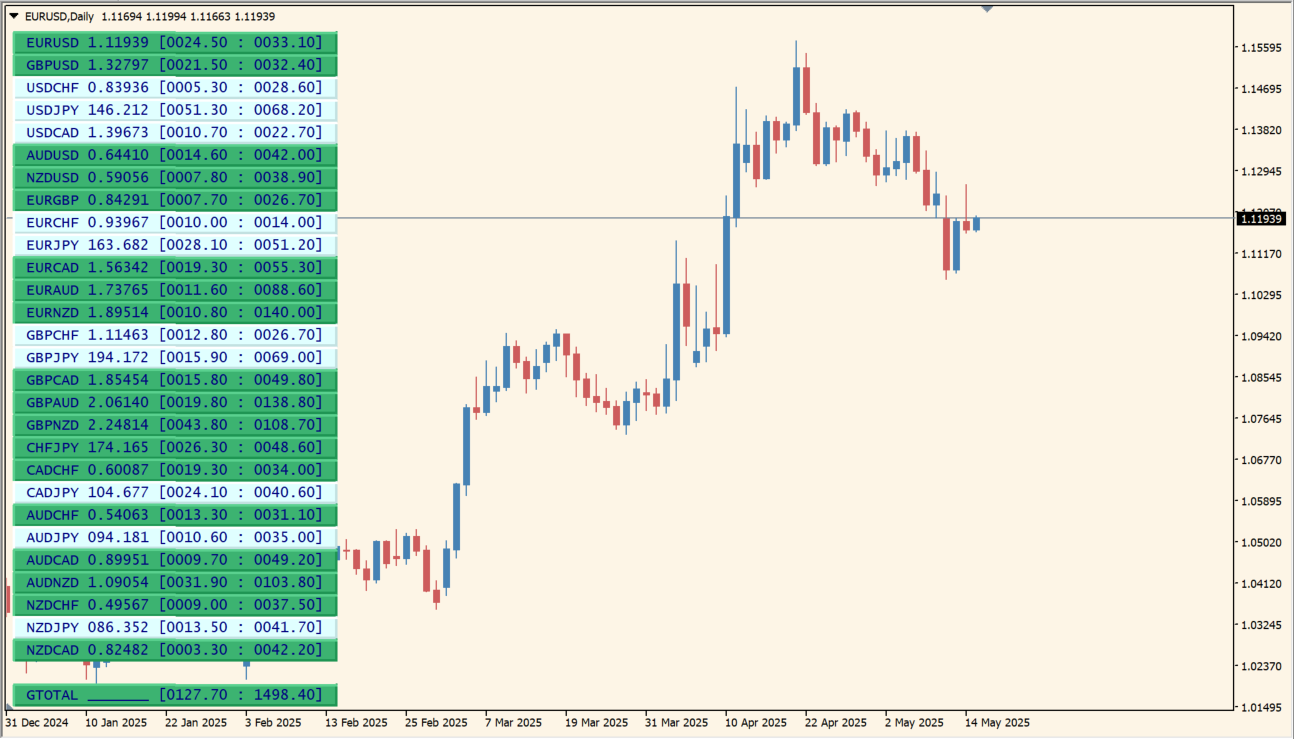
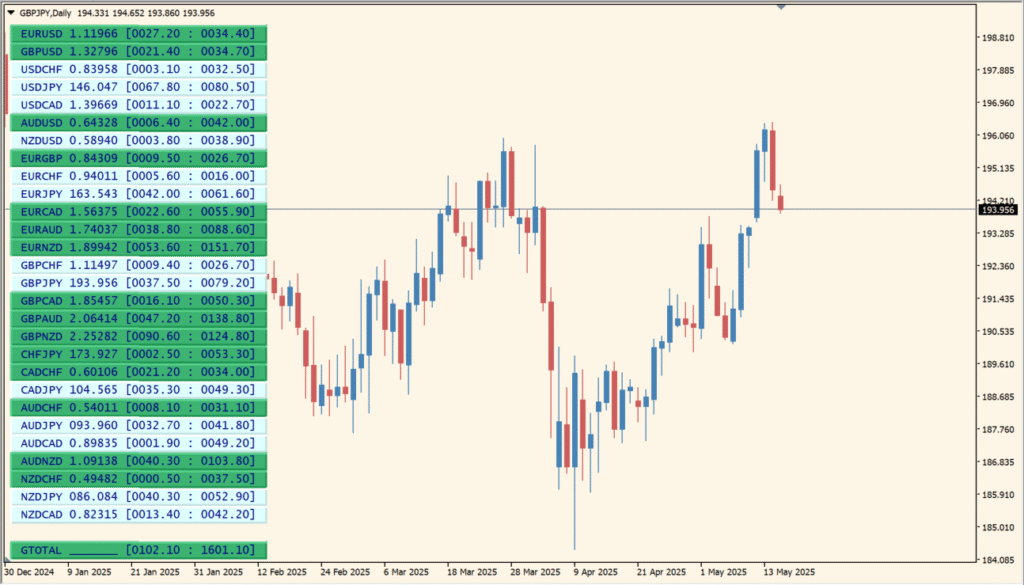
The Symbol Movement indicator for MT4 provides a clear and organized visual overview of price movements across multiple currency pairs. It displays each symbol’s movement data in a panel format, helping traders easily identify trends, volatility, and performance over a specific timeframe. This tool is particularly useful for multi-pair traders and those who want to spot the most active or trending markets at a glance.
It works by calculating the price change over a certain number of candles and then visualizing the results with colored buttons representing bullish or bearish movements.
How to Use It in Practice
In live trading, you can use the Symbol Movement indicator to:
- Monitor several currency pairs simultaneously without switching charts.
- Quickly identify which pairs are showing the strongest bullish or bearish momentum.
- Spot trends or reversals based on aggregated price movements.
- Navigate to specific charts directly by clicking on the buttons (if the “Change Current Chart” option is enabled).
This makes it an ideal tool for day traders or swing traders who base their decisions on market-wide activity rather than just single-pair analysis.
Parameter Explanations
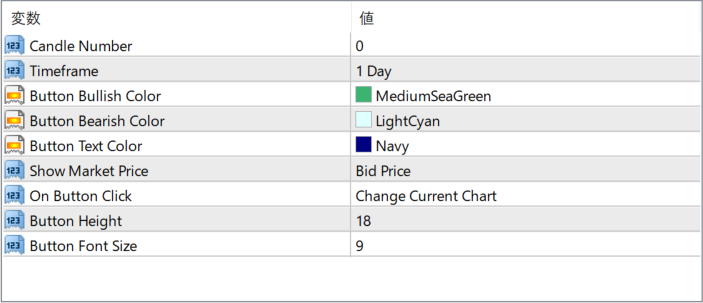
Candle Number
Sets how many candles (bars) are used to calculate the price movement. A higher number provides a longer-term view of movement, while a lower number focuses on short-term changes.
Timeframe
Specifies the timeframe on which the movement analysis is based (e.g., 1 Day, 1 Hour, etc.). This determines the scale of the movement measurement.
Button Bullish Color
Defines the background color of the button when a currency pair has moved up (bullish) over the selected period.
Button Bearish Color
Defines the background color of the button when a currency pair has moved down (bearish) over the selected period.
Button Text Color
Sets the color of the text shown inside each button.
Show Market Price
Specifies what price is displayed in the buttons — options typically include Bid Price or Ask Price.
On Button Click
Determines the action when a button is clicked. This can be set to change the current chart to the selected symbol or take no action.
Button Width
Controls the width of each button in pixels. Wider buttons allow for more readable data display.
Button Height
Controls the height of each button in pixels.
Button Font Size
Sets the font size of the text shown inside each button for better readability.