Overview of the T3 Floating Levels Indicator

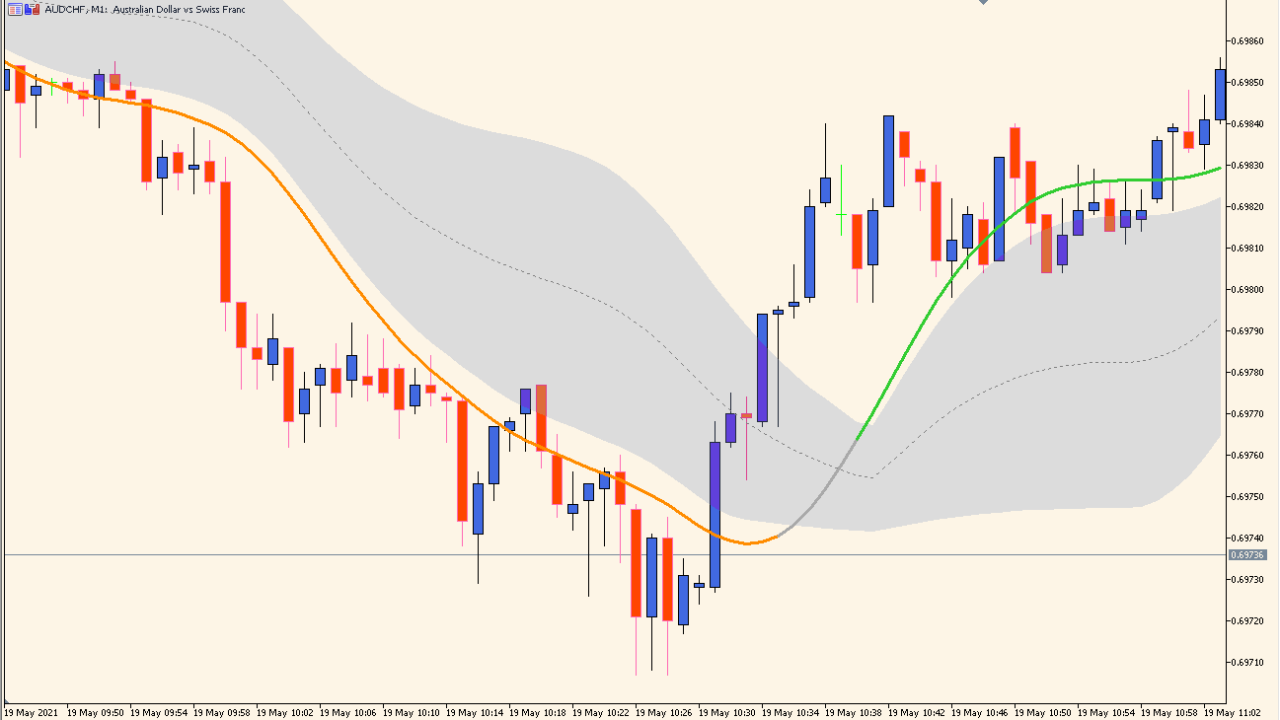
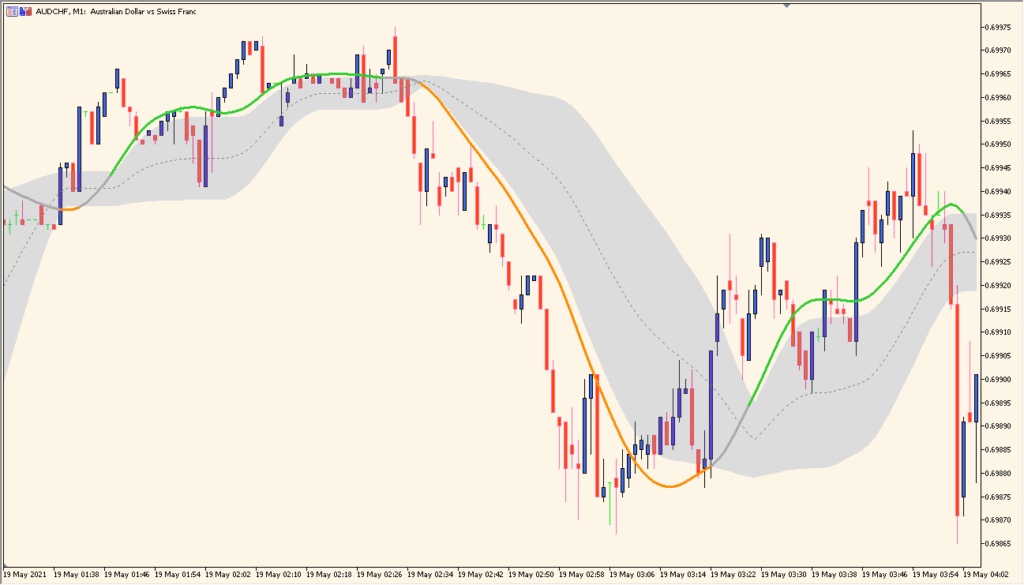
The T3 Floating Levels indicator uses the T3 moving average to create dynamic upper and lower levels that “float” with price movements. These levels are calculated based on percentage distances from the T3 average, helping traders identify potential overbought and oversold zones in real time. The indicator can also change colors when price crosses these levels, providing visual cues for trend changes or momentum shifts.
How to Use It in Practice
In trading, you can use the T3 Floating Levels indicator to:
- Spot potential reversal areas when price reaches the upper or lower floating level.
- Confirm trend direction by observing price in relation to the T3 line.
- Use color changes as a visual signal for potential entry or exit points.
- Adjust the upper and lower level percentages to match volatility conditions of the instrument.
This makes it suitable for both trend-following and counter-trend strategies, especially when combined with other confirmation tools.
Parameter Explanations
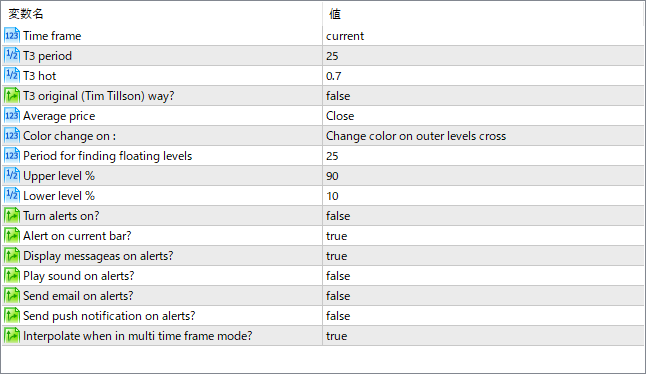
Time frame
Selects the chart timeframe for the calculation. Can be set to the current chart or a higher/lower timeframe for multi-timeframe analysis.
T3 period
Defines the number of periods used to calculate the T3 moving average.
T3 hot
Controls the smoothing factor of the T3 moving average. Higher values make the curve smoother but slower to react.
T3 original (Tim Tillson) way?
If enabled, uses the original Tim Tillson calculation method for the T3 average.
Average price
Specifies which price type (Close, Open, High, Low, etc.) is used for the T3 calculation.
Color change on
Defines the condition for changing the indicator’s color (e.g., when price crosses outer levels).
Period for finding floating levels
Number of bars used to determine the floating levels above and below the T3 line.
Upper level %
Percentage above the T3 line to set the upper floating level.
Lower level %
Percentage below the T3 line to set the lower floating level.
Turn alerts on?
Enables or disables alerts when conditions are met.
Alert on current bar?
When enabled, triggers alerts immediately on the current forming candle instead of waiting for bar close.
Display messages on alerts?
Shows a pop-up message when an alert is triggered.
Play sound on alerts?
Plays an audio notification when an alert condition is met.
Send email on alerts?
Sends an email when the alert condition is triggered (requires email setup in the platform).
Send push notification on alerts?
Sends a push notification to the connected mobile app when alerts occur.
Interpolate when in multi time frame mode?
When using higher timeframe data on a lower timeframe chart, interpolates values between bars for smoother display.