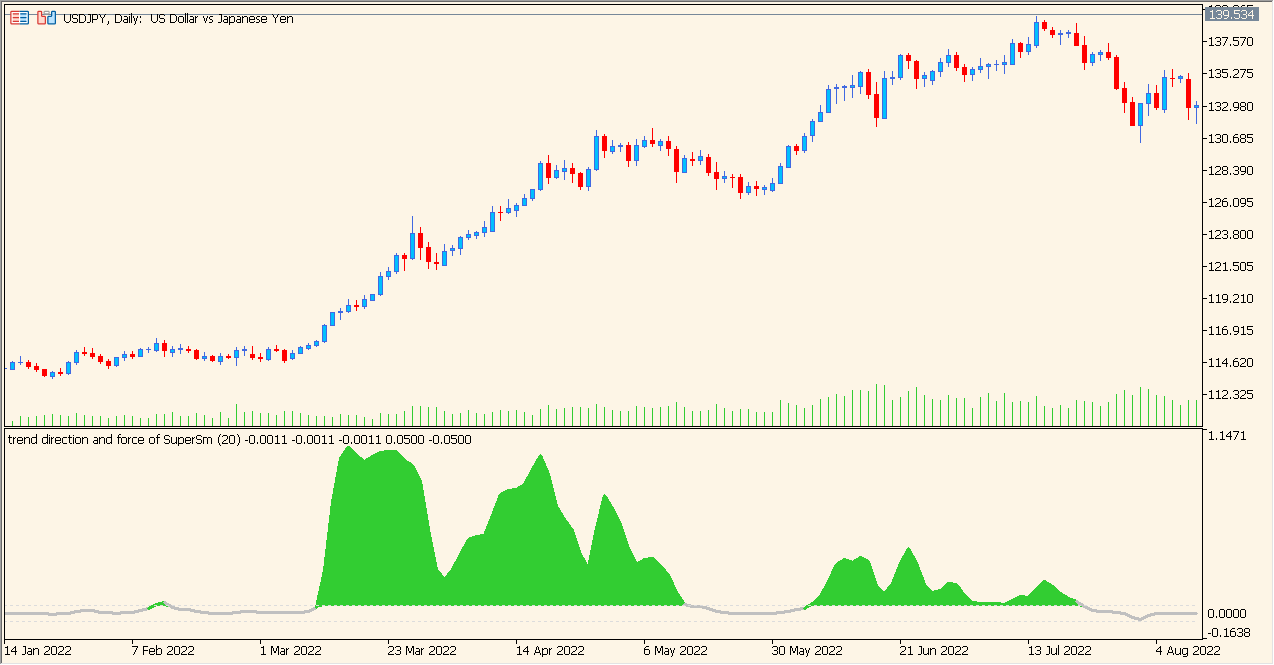
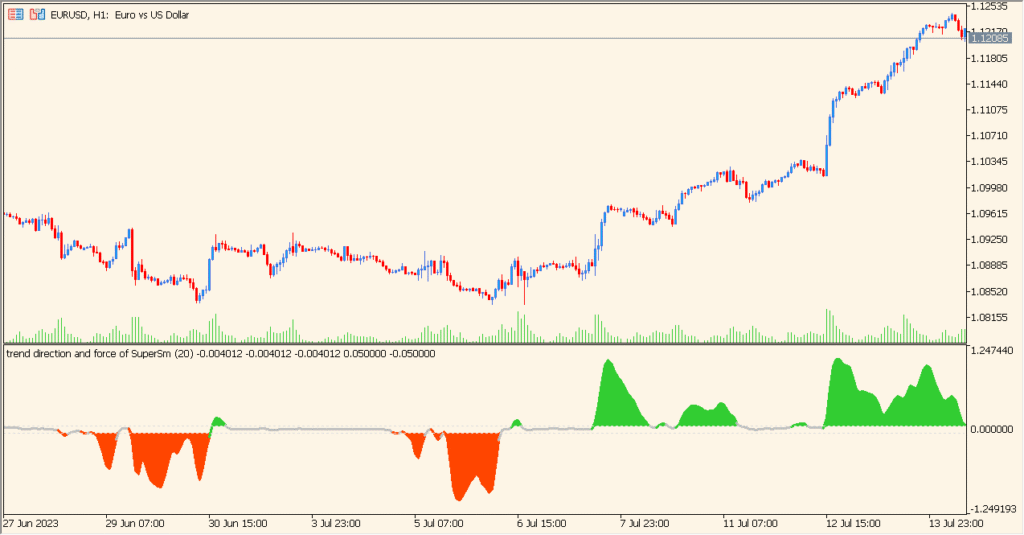
Overview of the Trend direction and force index averages Indicator

The Trend direction and force index averages indicator visualizes trend strength using a smoothed momentum calculation. It applies multiple smoothing steps to the price and then converts the result into a histogram that moves above or below the zero line. The green peaks represent positive trend force, while drops below zero reflect negative pressure.
This indicator is designed to help traders quickly judge whether the market is gaining or losing strength, without relying on noisy raw momentum data.
How to Use It in Practice
In live trading, you can use this indicator to:
- Identify when trend strength is building above or below the zero line.
- Use peaks and troughs as early signals of losing momentum.
- Filter entries by only trading in the direction of the active trend force.
- Combine with moving averages or price-action signals for timing entries.
The histogram gives an immediate sense of directional force, making it useful for trend-following strategies and pullback confirmation.
Parameter Explanations
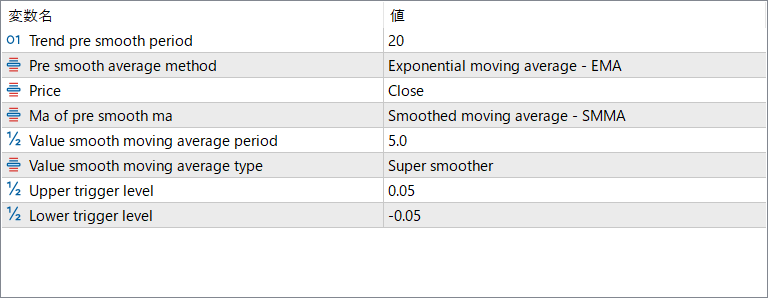
Trend pre smooth period
Sets the period used to smooth the price before calculating the main value.
Pre smooth average method
Selects the type of moving average used for the initial smoothing stage.
Price
Defines which price value (close, open, etc.) is used for calculations.
Ma of pre smooth ma
Applies a secondary smoothing pass to the first smoothed value.
Value smooth moving average period
Controls the smoothing strength of the final output value.
Value smooth moving average type
Chooses the smoothing algorithm applied to the final value.
Upper trigger level
Defines the level above zero used to highlight strong positive trend force.
Lower trigger level
Defines the level below zero used to highlight strong negative trend force.