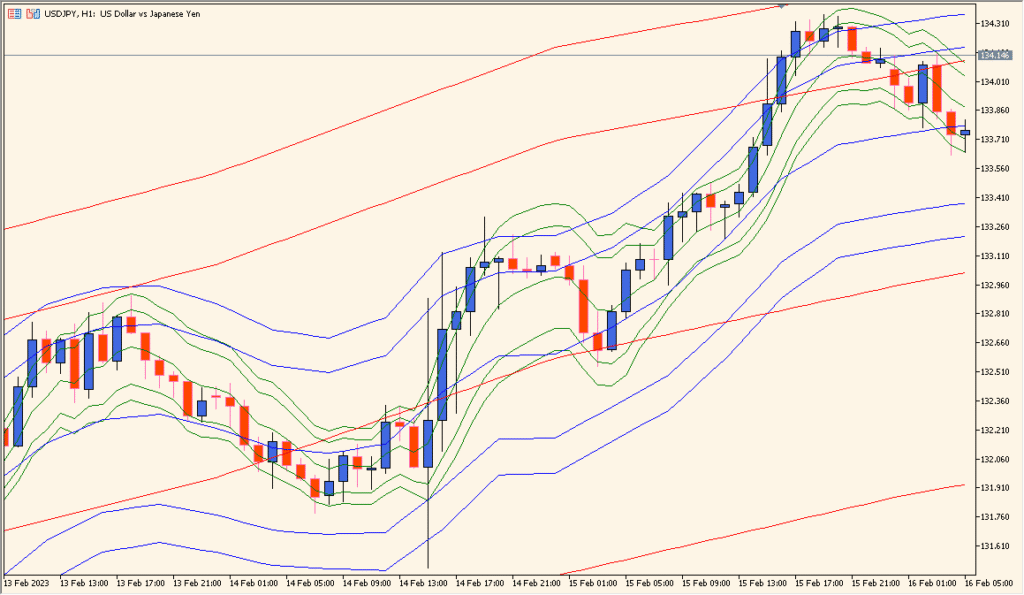
Overview of the Tymen STARCBands MTF Indicator
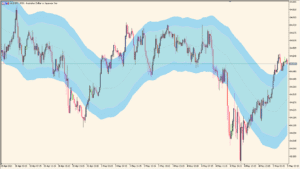
The Tymen STARCBands MTF indicator displays STARC Bands (Stoller Average Range Channels) across multiple timeframes on a single chart. It helps traders visualize volatility zones and price extremes using Average True Range (ATR) and Moving Averages. By layering short-, mid-, and long-term bands, traders can easily identify overbought and oversold areas with broader market context.
This indicator is ideal for traders who combine multi-timeframe analysis with volatility-based strategies. It provides a structured view of how price behaves relative to its dynamic range boundaries, making it easier to spot high-probability entries or exits.
How to Use It in Practice
In practical trading, the Tymen STARCBands MTF indicator can be used to:
- Identify potential overbought or oversold conditions when price touches the upper or lower bands.
- Compare short-term volatility against longer-term ranges using multiple timeframes.
- Use middle lines as dynamic support or resistance zones for pullback entries.
- Align entries across timeframes — for example, entering trades when lower timeframe bands agree with higher timeframe zones.
- Visually confirm volatility contraction or expansion phases based on band width.
Parameter Explanations
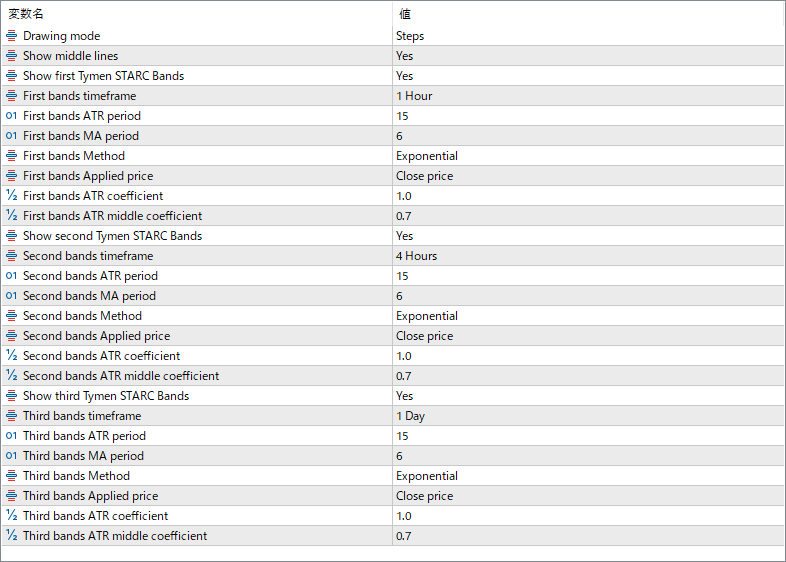
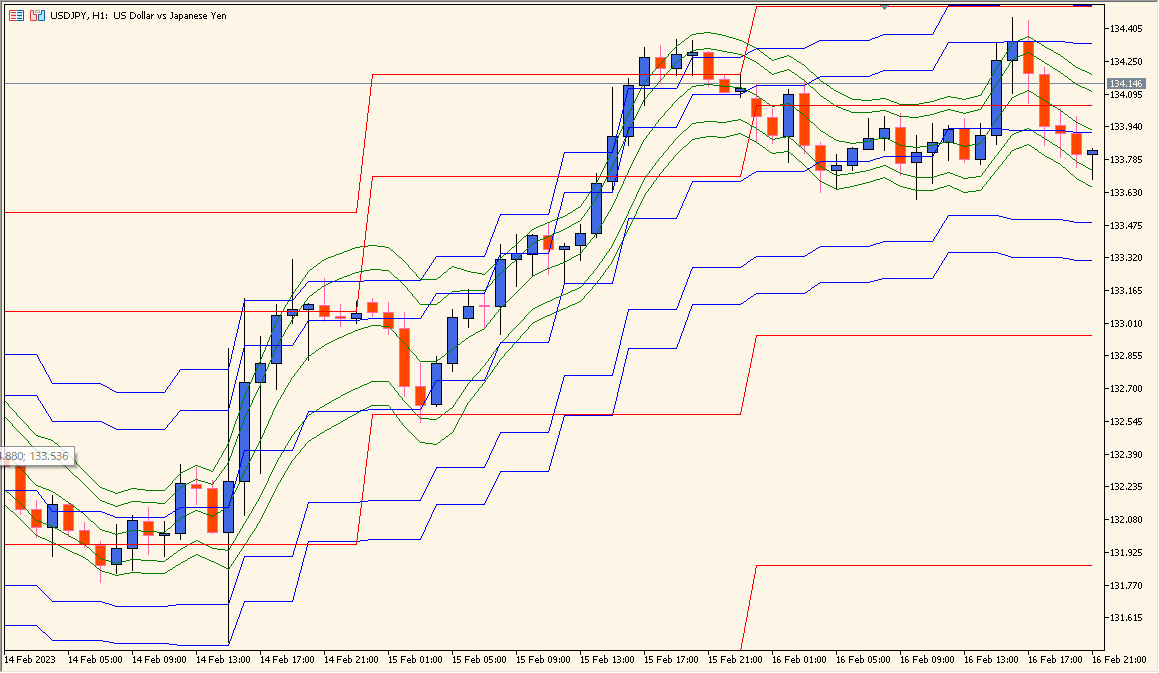
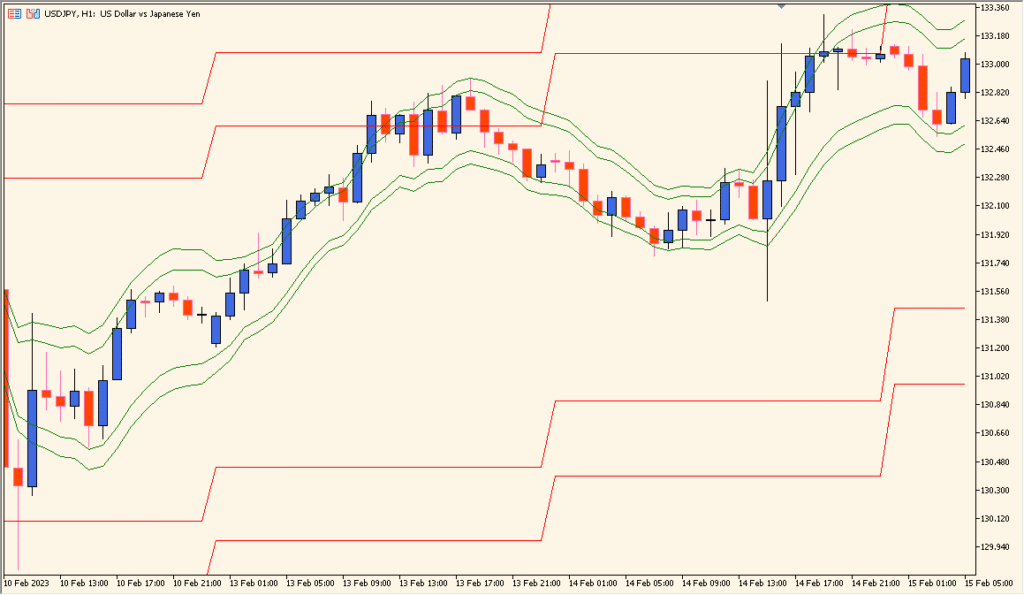
Drawing mode
Sets how the bands are drawn on the chart. “Steps” mode creates horizontal steps between updates for a cleaner MTF display.
Show middle lines
Enables or disables the display of the Moving Average center line for each band set.
Show first Tymen STARC Bands
Toggles visibility for the first (base) STARC band group.
First bands timeframe
Defines the timeframe used for the first band calculation (e.g., 1 Hour).
First bands ATR period
Number of bars used for ATR calculation that determines volatility width.
First bands MA period
Number of bars for the Moving Average used as the central line of the bands.
First bands Method
Type of Moving Average used (e.g., Exponential, Simple).
First bands Applied price
Defines which price is used for the Moving Average (e.g., Close, Open, Median).
First bands ATR coefficient
Multiplier for ATR to set the outer band distance from the MA line.
First bands ATR middle coefficient
Multiplier for ATR to draw the inner or middle band lines between the MA and outer limits.
Show second Tymen STARC Bands
Turns on or off the second (higher timeframe) band group for multi-timeframe comparison.
Second bands timeframe
Sets the timeframe for the second STARC bands (e.g., 4 Hours).
Second bands ATR period
Defines how many bars are used to measure volatility on the second timeframe.
Second bands MA period
Number of bars used for the Moving Average calculation on the second timeframe.
Second bands Method
Moving Average type for the second timeframe (e.g., Exponential).
Second bands Applied price
Defines which price data is used for the second MA and bands.
Second bands ATR coefficient
ATR multiplier for outer band distance on the second timeframe.
Second bands ATR middle coefficient
Multiplier used for drawing inner mid-level bands on the second timeframe.
Show third Tymen STARC Bands
Displays or hides the third (typically highest timeframe) STARC band group.
Third bands timeframe
Defines the timeframe used for the third STARC band calculation (e.g., 1 Day).
Third bands ATR period
Sets the number of bars used for the ATR volatility calculation for the third timeframe.
Third bands MA period
Determines how many bars are used for the central Moving Average line on the third timeframe.
Third bands Method
Type of Moving Average for the third band set.
Third bands Applied price
Specifies which price is used to calculate the Moving Average and bands.
Third bands ATR coefficient
Multiplier that adjusts the distance of the outer bands for the third timeframe.
Third bands ATR middle coefficient
Multiplier that controls the distance for inner mid-bands on the third timeframe.