Overview of the Indicator
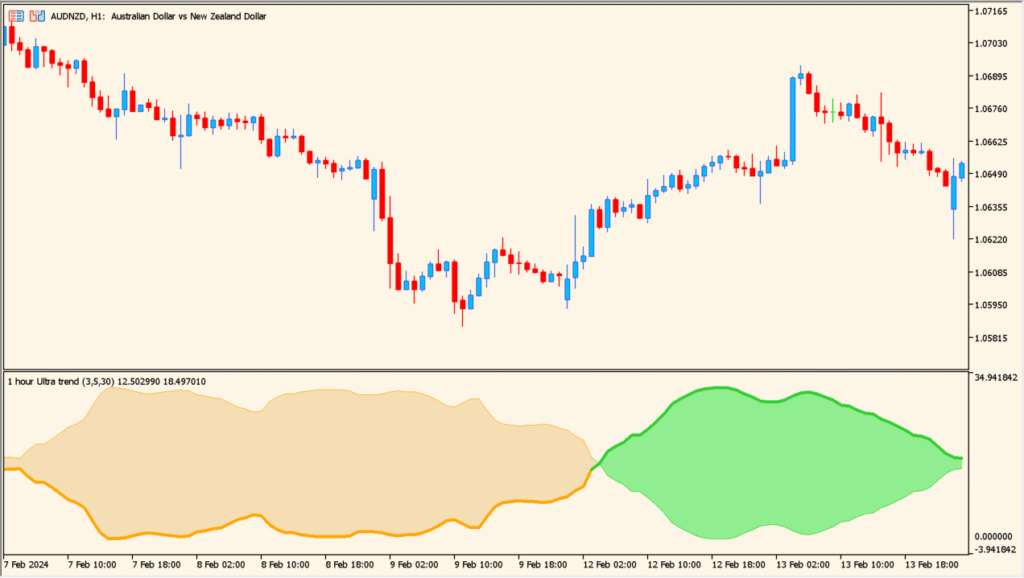
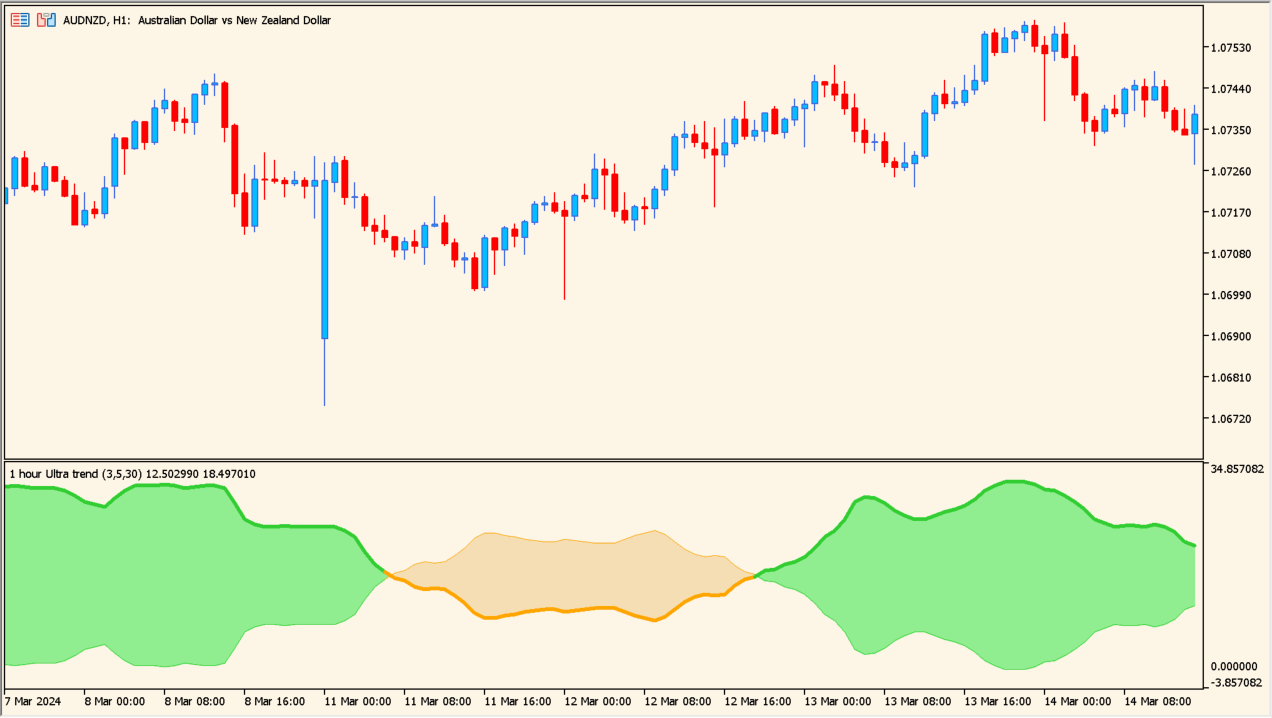
The Ultra Trend MTF indicator is a trend-following tool designed to show market direction with a smooth and readable oscillator-style display. It analyzes price movement using adaptive smoothing and presents the result as a colored wave, making trend bias easy to recognize at a glance.
The indicator also supports multi-timeframe analysis, allowing you to view higher-timeframe trend information directly on a lower-timeframe chart without switching charts.
How to Use It in Practice

In real trading scenarios, the Ultra Trend MTF indicator can be used to:
Identify the dominant market trend based on the color and direction of the wave. A rising green area suggests bullish conditions, while a falling orange area points to bearish pressure.
Filter entries by trading only in the direction of the higher-timeframe trend, reducing false signals in ranging or choppy markets.
Combine it with price action or other entry tools to improve timing, using the indicator mainly as a directional and context filter rather than a standalone entry signal.
Parameters
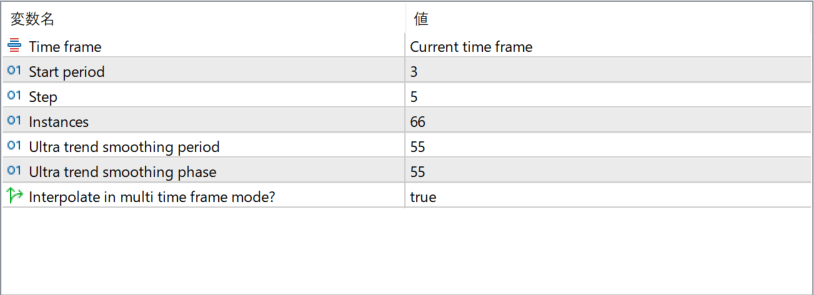
Time frame
Defines which timeframe the trend calculation is based on. When set to the current timeframe, the indicator follows the active chart. Higher timeframes can be selected for broader trend context.
Start period
Sets the initial lookback period used in the trend calculation. Smaller values react faster to price changes, while larger values produce smoother results.
Step
Controls how the period progresses internally during calculations. This affects how gradually the trend adapts to changing market conditions.
Instances
Determines how many calculation layers are used to build the final trend output. More instances result in smoother and more stable signals.
Ultra trend smoothing period
Defines the smoothing length applied to the trend line. Increasing this value reduces noise but adds lag.
Ultra trend smoothing phase
Adjusts the phase of the smoothing algorithm, influencing how early or late the indicator responds to trend changes.
Interpolate in multi time frame mode?
When enabled, the indicator smooths transitions between higher-timeframe values on lower-timeframe charts, creating a cleaner and more continuous display.