Indicator Explanation
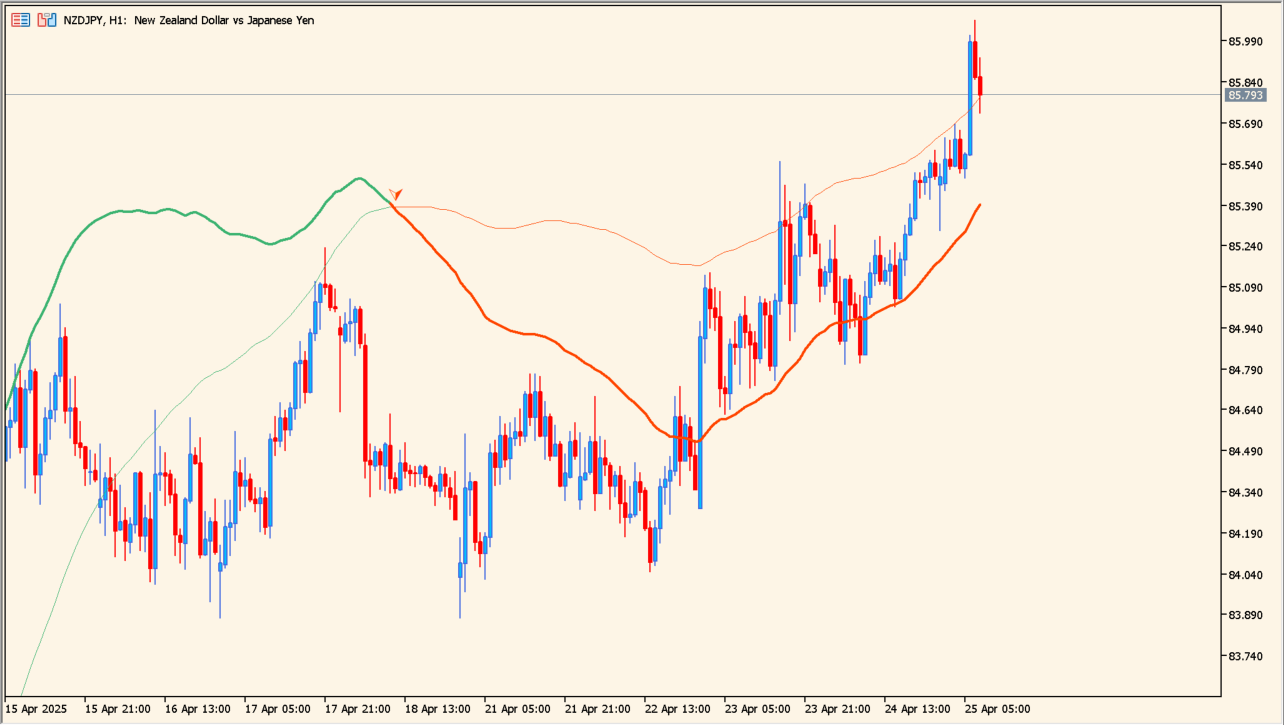
This indicator, called vervoort-crossover-extended-indicator, is based on the crossover of two TEMA (Triple Exponential Moving Averages). TEMA is known for having less lag compared to standard moving averages, making it quicker to detect trend changes and reversals.
On the chart, two TEMA lines are drawn. When they cross, arrows are displayed: green arrows indicate a potential buy signal, and red arrows indicate a potential sell signal.
Additionally, unlike typical moving average indicators, this version allows the use of Heiken Ashi data instead of just standard price data, adding a smoothing effect to reduce noise.
Parameter Explanations
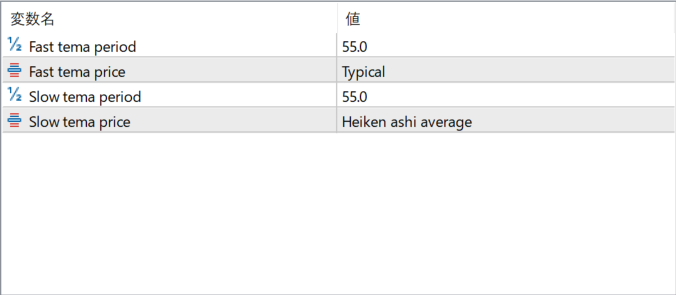
Fast tema period
Sets the period for the fast (short-term) TEMA. A smaller value makes the TEMA more sensitive to price movements.
Fast tema price
Specifies the type of price used for calculating the fast TEMA. Options include typical price, close price, or, with the extended features, Heiken Ashi-based prices.
Slow tema period
Sets the period for the slow (long-term) TEMA. A larger value makes the TEMA smoother and less sensitive to short-term price fluctuations.
Slow tema price
Specifies the type of price used for calculating the slow TEMA. Selecting “Heiken ashi average” uses Heiken Ashi values instead of regular candlestick prices, providing additional smoothing.