Overview of the VP-Range-v6 Indicator

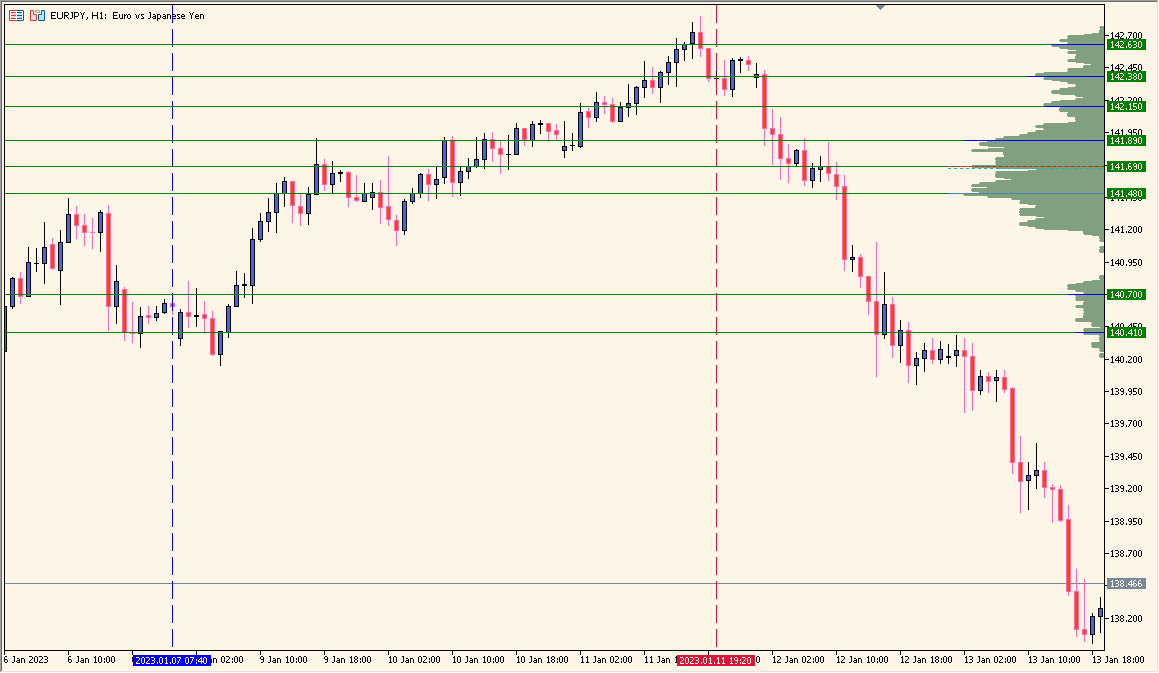
The VP-Range-v6 indicator for MT4 displays a visual representation of traded volume within a specified price range. It works as a Volume Profile tool that helps traders identify areas of high and low trading activity, commonly referred to as value areas. This visualization allows you to see where most of the market participants have positioned their orders, providing a clearer picture of potential support and resistance zones.
By analyzing the distribution of volume across price levels, traders can determine which prices are attracting the most interest and use this data to refine entries, exits, and stop placements. It’s particularly useful for volume-based and market structure traders who want a deeper insight into price behavior beyond standard candlestick analysis.
How to Use It in Practice
In real trading, you can use VP-Range-v6 to:
- Identify high-volume price zones where strong support or resistance may exist.
- Find low-volume gaps that can act as potential breakout or rejection areas.
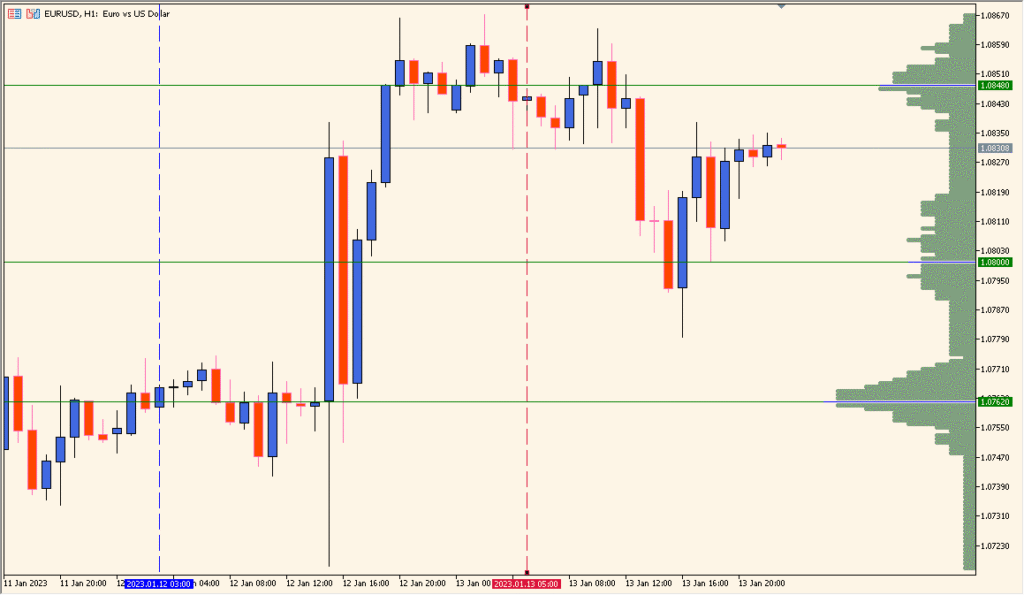
- Observe how volume shifts within specific time or price ranges to confirm market bias.
- Combine it with VWAP or mode lines to detect equilibrium points or fair value levels.
This tool is valuable for intraday, swing, and position traders who want to analyze price acceptance zones and improve their market timing based on real trading activity.
Parameter Explanations
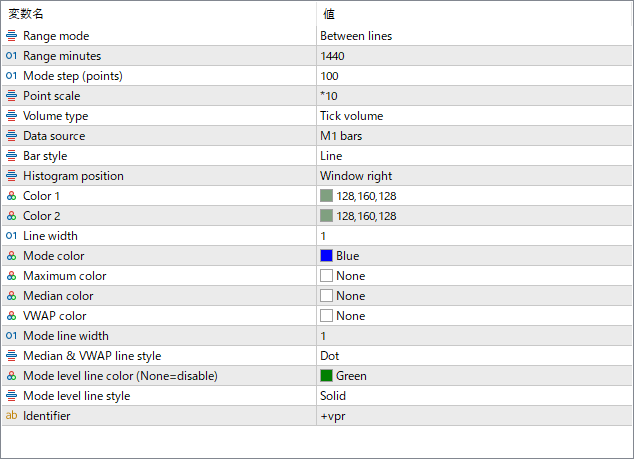
Range mode
Defines how the profile range is selected — for example, between two vertical lines or fixed periods.
Range minutes
Specifies the time duration (in minutes) that the indicator uses to calculate the profile.
Mode step (points)
Sets the price step or resolution for building the volume histogram.
Point scale
Adjusts the horizontal scaling of the histogram bars to control their visual width.
Volume type
Chooses whether the profile is based on tick volume or real volume (depending on broker data).
Data source
Selects the data interval used for volume calculation, such as M1 bars for higher precision.
Bar style
Determines how the histogram bars are drawn — for example, as lines or filled shapes.
Histogram position
Defines where the profile is displayed on the chart (e.g., right side or left side of the window).
Color 1 / Color 2
Sets the gradient or alternating colors of the histogram bars for visual contrast.
Mode color
Specifies the color of the mode (the price level with the highest volume).
Maximum color
Defines the color used to highlight the absolute maximum volume level, if enabled.
Median color
Sets the color for the median volume level across the selected range.
VWAP color
Specifies the color of the VWAP (Volume Weighted Average Price) line, if displayed.
Line width
Adjusts the thickness of histogram outline lines.
Mode line width
Sets the width of the line marking the mode (highest volume) level.
Median & VWAP line style
Defines the visual style (e.g., dotted or solid) for median and VWAP lines.
Mode level line color
Sets the color of the horizontal level line at the mode price. If set to “None,” the line is hidden.
Mode level line style
Specifies the line style used for the mode level (solid, dashed, etc.).
Identifier
Used internally to differentiate multiple instances of the indicator on the same chart.