Overview of the WPR Histogram Vol Indicator
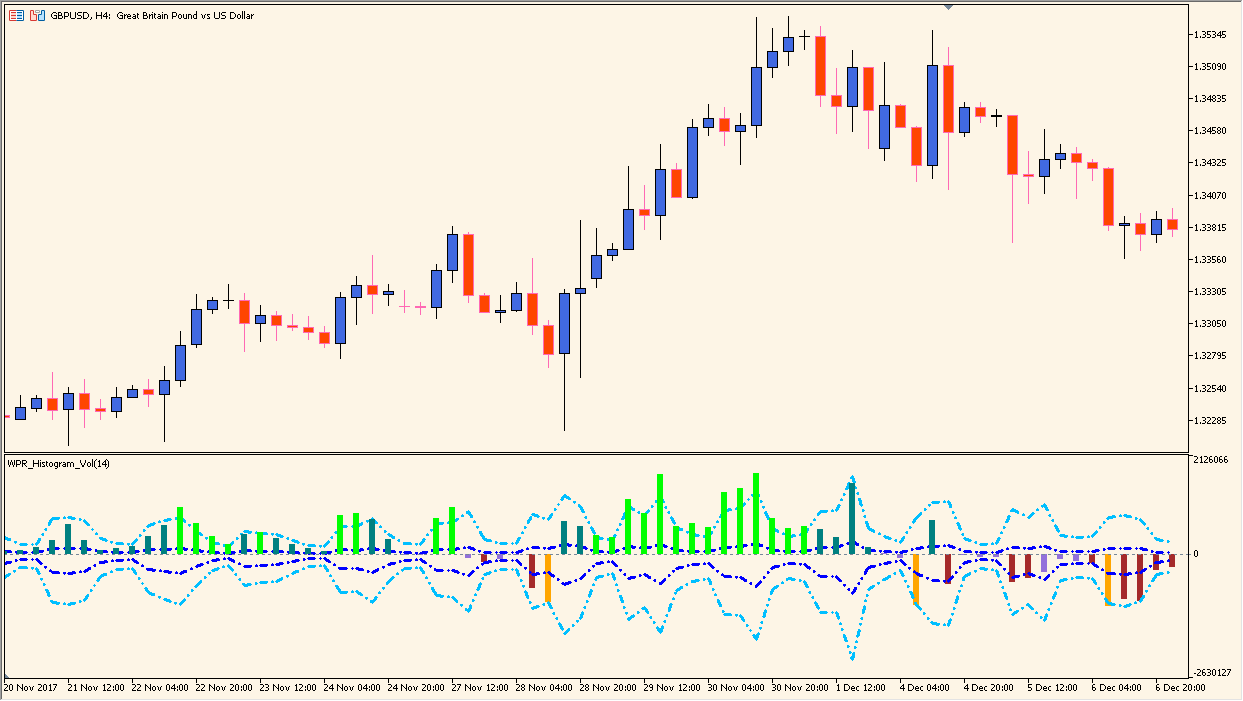
The WPR Histogram Vol indicator is based on the Williams %R oscillator but visualized in a histogram format. It combines momentum analysis with volume data, offering a more detailed view of overbought and oversold conditions. By using histogram bars and color changes, traders can quickly assess momentum strength and potential reversal areas.
The addition of volume makes this tool more responsive, helping traders filter out weaker signals and focus on areas where market participation supports price action.
How to Use It in Practice
In live trading, the WPR Histogram Vol can be applied to:
- Identify overbought and oversold areas using user-defined levels.
- Confirm reversals when momentum extremes align with strong volume.
- Filter trade entries by checking both price action and volume-driven momentum.
- Combine with trend indicators for better accuracy.
This indicator is particularly useful for traders who want to add volume confirmation to standard momentum oscillators.
Parameter Explanations
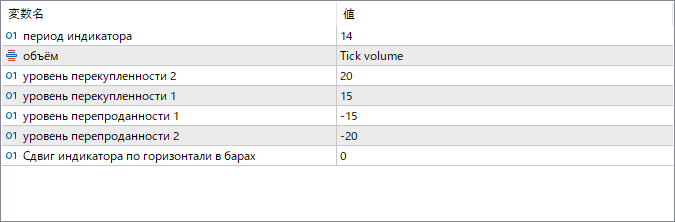
период индикатора
Sets the calculation period of the Williams %R oscillator. A shorter period makes the indicator more sensitive, while a longer period smooths the signals.
объём
Defines the type of volume used, such as tick volume or real volume, to enhance signal confirmation.
уровень перекупленности 2
Second threshold level for identifying overbought conditions. Reaching this value may indicate strong bullish exhaustion.
уровень перекупленности 1
First threshold level for overbought conditions. Crossing this value signals potential weakness in the bullish move.
уровень перепроданности 1
First threshold level for oversold conditions. Crossing below this value indicates possible bullish recovery.
уровень перепроданности 2
Second threshold level for oversold conditions. Reaching this level may point to strong bearish exhaustion.
Сдвиг индикатора по горизонтали в барах
Shifts the indicator forward or backward on the chart for visual alignment or testing purposes.