Overview of the WyattsPivots_v2.1_w_toggle Indicator
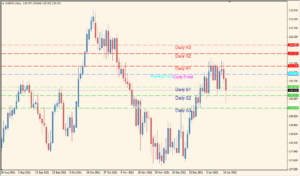
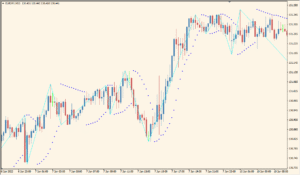
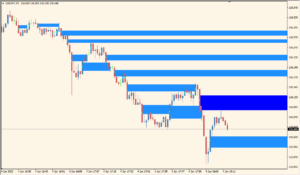
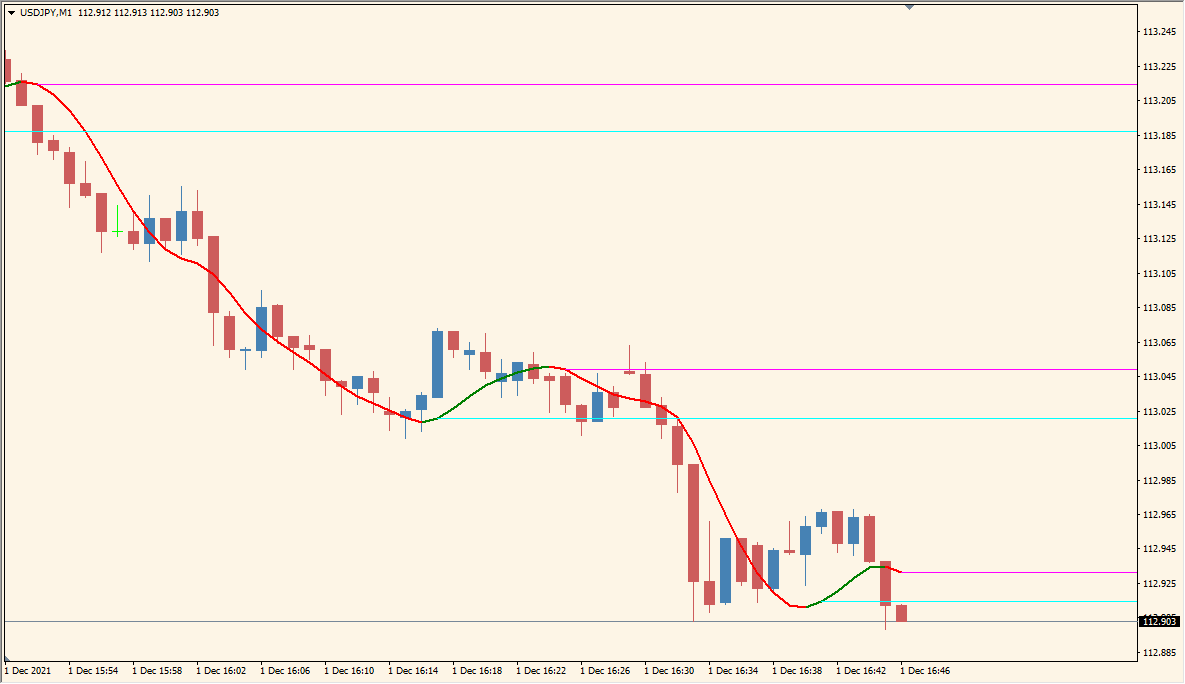
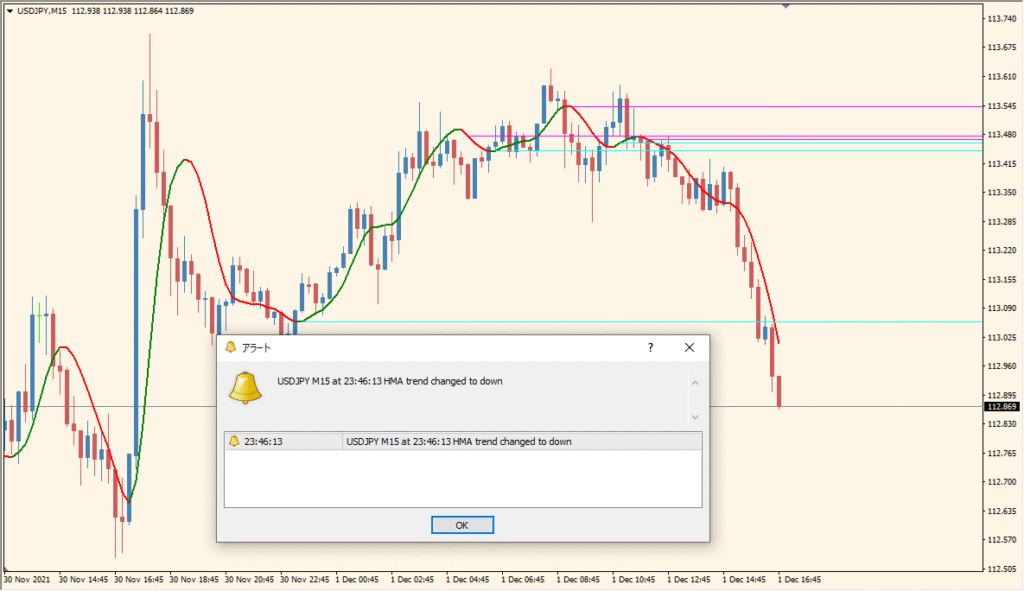
The WyattsPivots_v2.1_w_toggle indicator for MT4 displays standard pivot levels, including main pivot points, support (S1–S3), resistance (R1–R3), and midpoint levels. It also optionally draws future pivot zones based on the current day’s range. This helps traders identify potential price reaction zones and intraday turning points quickly.
The indicator uses simple visual elements like lines, labels, and colored zones to enhance clarity. It supports customization of line styles, widths, and colors, making it flexible for different trading styles and chart themes.
How to Use It in Practice
In live trading, the WyattsPivots indicator can help:
- Identify key intraday support and resistance levels for trade entries or exits.
- See where price may stall, bounce, or reverse based on historical pivot behavior.
- Visually plan profit targets or stop-loss placements using defined pivot levels.
- Use midpoint and zone shading to refine expectations around market congestion or breakout points.
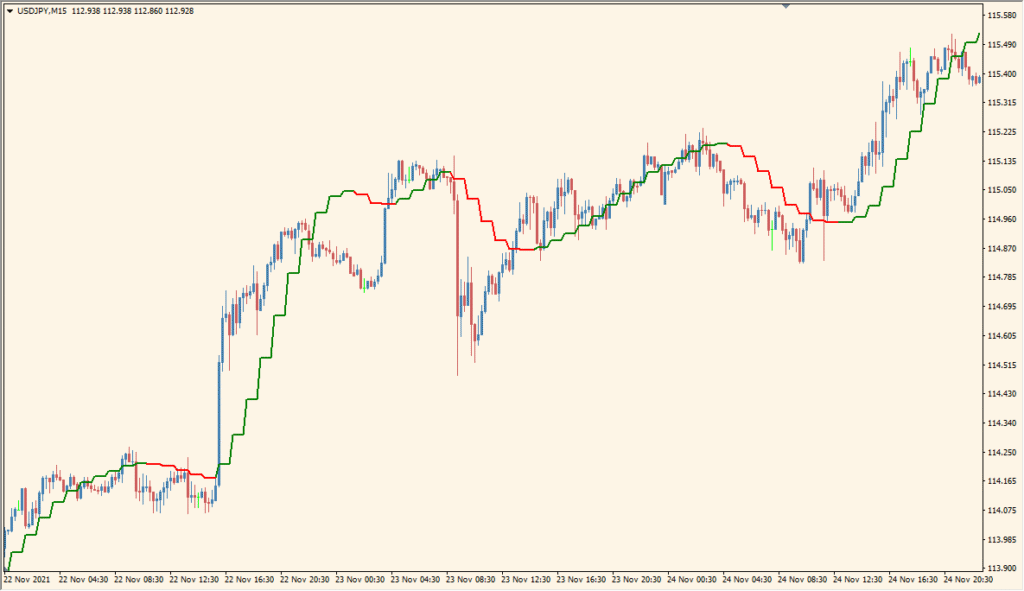
It’s best suited for intraday traders and scalpers who rely on price reaction at known horizontal levels, but can also be used for broader market context in higher timeframes.
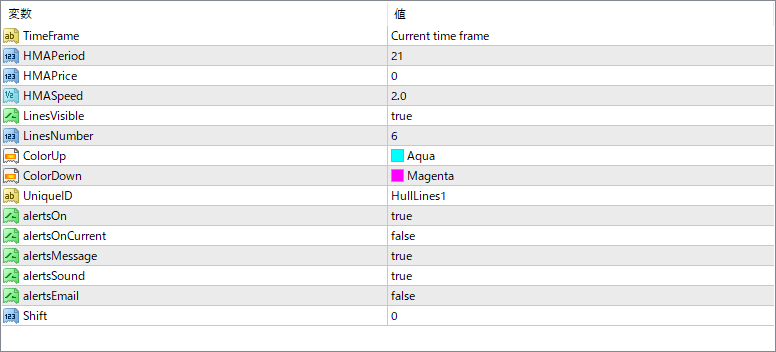
Parameter Explanations
iCountPeriods
Number of past periods to display pivot levels from.
iTimePeriod
The timeframe used for pivot calculation (e.g., Daily).
iShiftHours
Offsets the pivot calculation by a set number of hours, useful for different session alignments.
iPlotPivots
Toggle to show or hide the main pivot lines.
iPlotPivotFutures
Option to display projected/future pivot levels.
iPlotPivotLabels
Display labels like D1PP, D1R1, etc., on the chart for clarity.
iPlotPivotPrices
If true, shows exact price values for each pivot level.
iPlotPivotStyles
Choose line styles for the pivot lines (e.g., Solid).
iPlotPivotWidths
Defines the thickness of the pivot lines.
iPlotPivotColorRes
Color used for resistance lines (R1–R3).
iPlotPivotColorPP
Color used for the main pivot point (PP).
iPlotPivotColorSup
Color used for support lines (S1–S3).
iPlotMidpoints
Enables midpoint lines between pivot levels.
iPlotMidpointStyles
Line style used for midpoints (e.g., Dash).
iPlotMidpointWidths
Line width used for midpoints.
iPlotMidpointColorM35
Color for midpoint above PP (R1 side).
iPlotMidpointColorM02
Color for midpoint below PP (S1 side).
iPlotZones
Show shaded zones around key pivot levels for visual emphasis.
iPlotBuyZoneColor
Color used for buy zone shading (below pivot).
iPlotSellZoneColor
Color used for sell zone shading (above pivot).
iPlotBorders
If true, draws border lines around the zones.
iPlotBorderStyles
Line style for zone borders.
iPlotBorderWidths
Width of the border lines around the zones.
iPlotBorderColors
Color of the zone border lines.