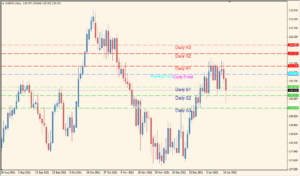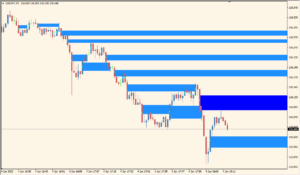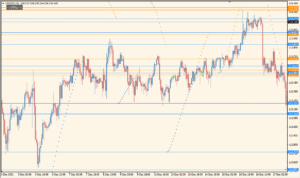
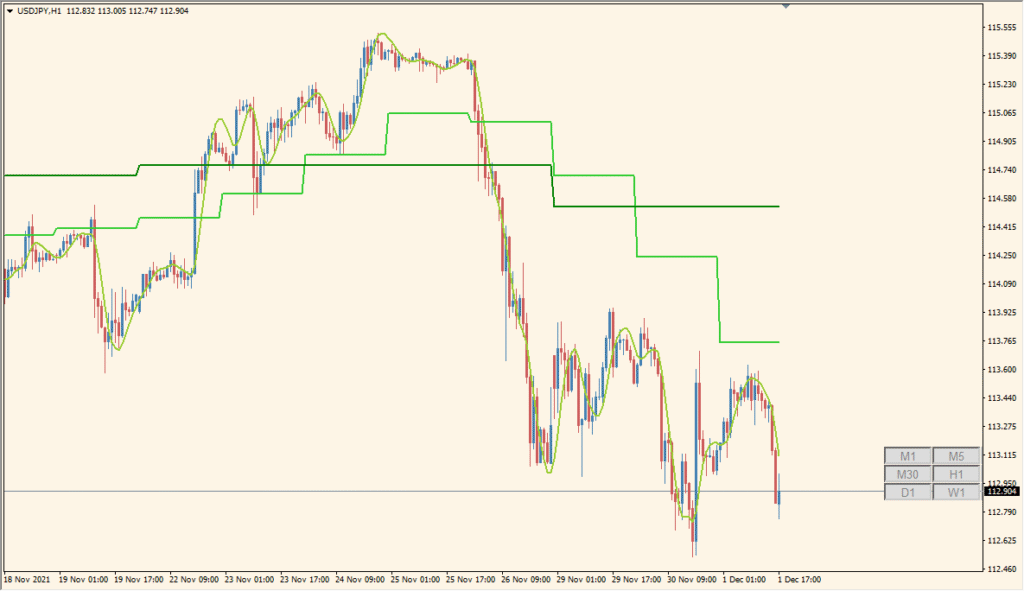
Overview of the WyattsPivots Indicator
The WyattsPivots indicator for MT4 plots daily pivot points along with their respective support and resistance levels. It also includes midpoints and optional zone highlights to give a visual structure to the market. This makes it easy to see key price reaction levels without manually calculating pivots.
This tool is helpful for traders who rely on pivot-based strategies or want to mark out significant turning points in price, both for breakout and reversal opportunities.
How to Use It in Practice
In live trading, the WyattsPivots indicator can be used to:
- Identify intraday support and resistance levels for scalping or day trading.
- Set up take-profit and stop-loss targets based on pivot or midpoint zones.
- Watch for potential breakouts or reversals at major pivot levels.
- Visually separate today’s and future pivot levels for clearer chart navigation.
This indicator is especially useful for technical traders who focus on price structure and reaction zones.
Parameter Explanations
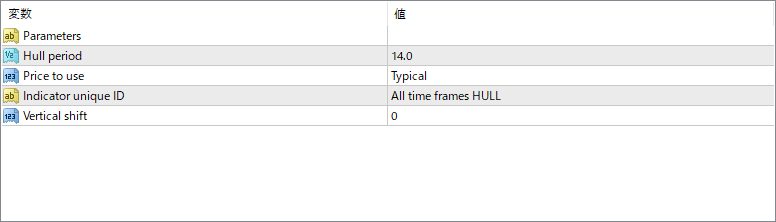
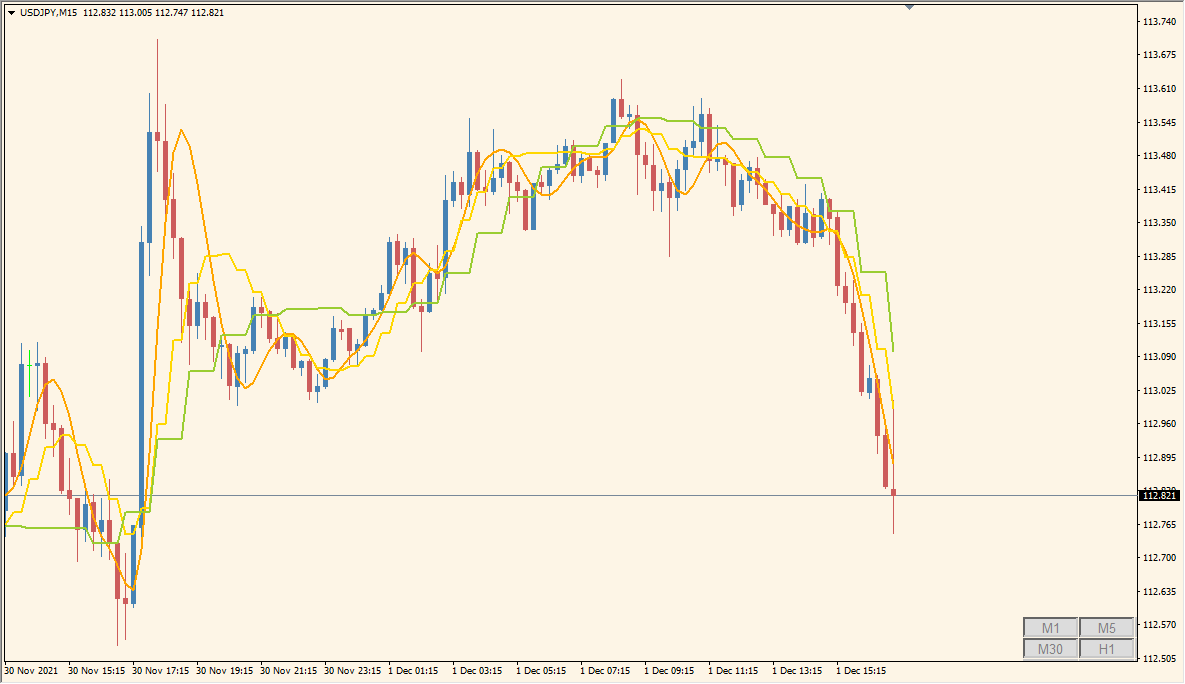
iCountPeriods
Sets how many past pivot periods are displayed on the chart.
iTimePeriod
Specifies the timeframe used to calculate pivots (e.g., 1 Day).
iShiftHours
Adjusts pivot calculation timing by shifting hours forward or backward.
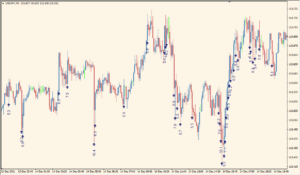
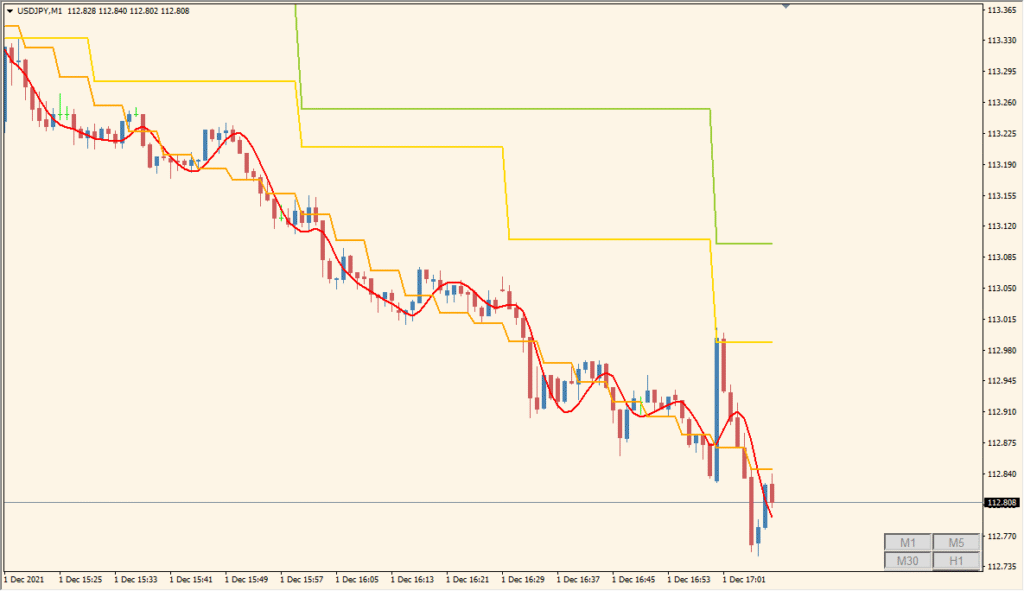
iPlotPivots
Enables or disables the drawing of pivot lines.
iPlotPivotFutures
If true, displays the next period’s projected pivot levels.
iPlotPivotLabels
Shows labels like R1, S1, PP, etc., on the chart.
iPlotPivotPrices
Displays the exact price values next to pivot labels.
iPlotPivotStyles
Sets the line style used for pivot levels (e.g., solid).
iPlotPivotWidths
Adjusts the thickness of pivot lines.
iPlotPivotColorRes
Color for resistance pivot lines (R1, R2, etc.).
iPlotPivotColorPP
Color for the central pivot point (PP).
iPlotPivotColorSup
Color for support pivot lines (S1, S2, etc.).
iPlotMidpoints
Enables drawing of midpoint levels between pivot levels.
iPlotMidpointStyles
Style of the midpoint lines (e.g., dashed).
iPlotMidpointWidths
Line width for midpoint levels.
iPlotMidpointColorM35
Color for midpoint between R3 and R5.
iPlotMidpointColorM02
Color for midpoint between S0 and S2.
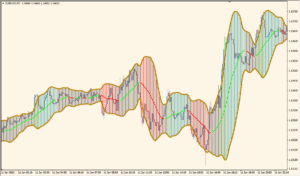
iPlotZones
Enables shaded background zones around key pivot areas.
iPlotBuyZoneColor
Color for the support zone (buy area).
iPlotSellZoneColor
Color for the resistance zone (sell area).
iPlotBorders
Enables borders around the shaded zones.
iPlotBorderStyles
Style of the zone borders.
iPlotBorderWidths
Width of the zone border lines.
iPlotBorderColors
Color used for the zone border lines.