Overview of the WyattsPivots_v2.1_w_toggle Indicator

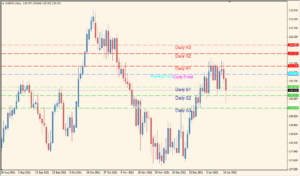
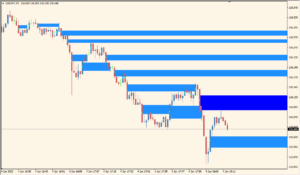
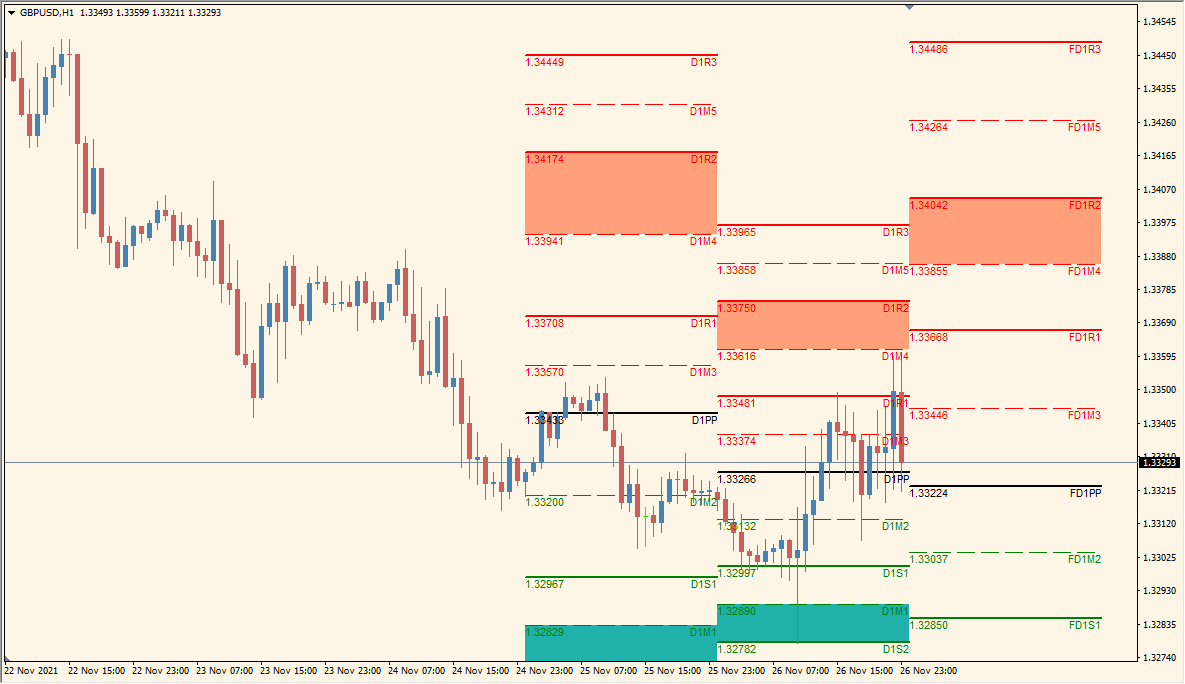
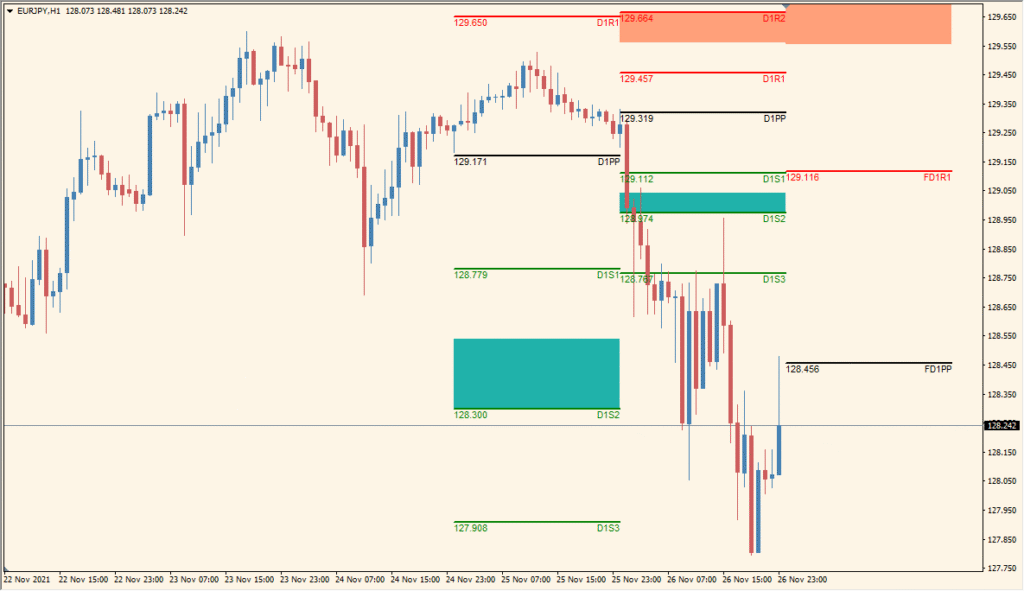
The WyattsPivots_v2.1_w_toggle indicator displays pivot point levels, support/resistance zones, and midpoints based on the previous day’s price action. It helps traders identify key decision areas on the chart such as potential reversal or breakout zones. The indicator also includes customization for visual style, color, and time shift, offering flexibility for different trading styles.
Pivot levels include central pivot points (PP), resistance levels (R1-R4), support levels (S1-S4), and midpoint levels between pivots. Zones and future projections can also be toggled on or off.
How to Use It in Practice
Here’s how you can apply this pivot indicator in your daily trading:
- Use PP as a reference for intraday bias — trading above = bullish, below = bearish.
- Watch for reactions at R1/R2 and S1/S2 to time reversals or breakout entries.
- Enable midpoints to refine entry levels or define tighter stop-loss zones.
- Combine with candlestick signals or momentum indicators near these levels for confirmation.
This tool suits intraday and swing traders who want structured support and resistance based on historical price behavior.
Parameter Explanations
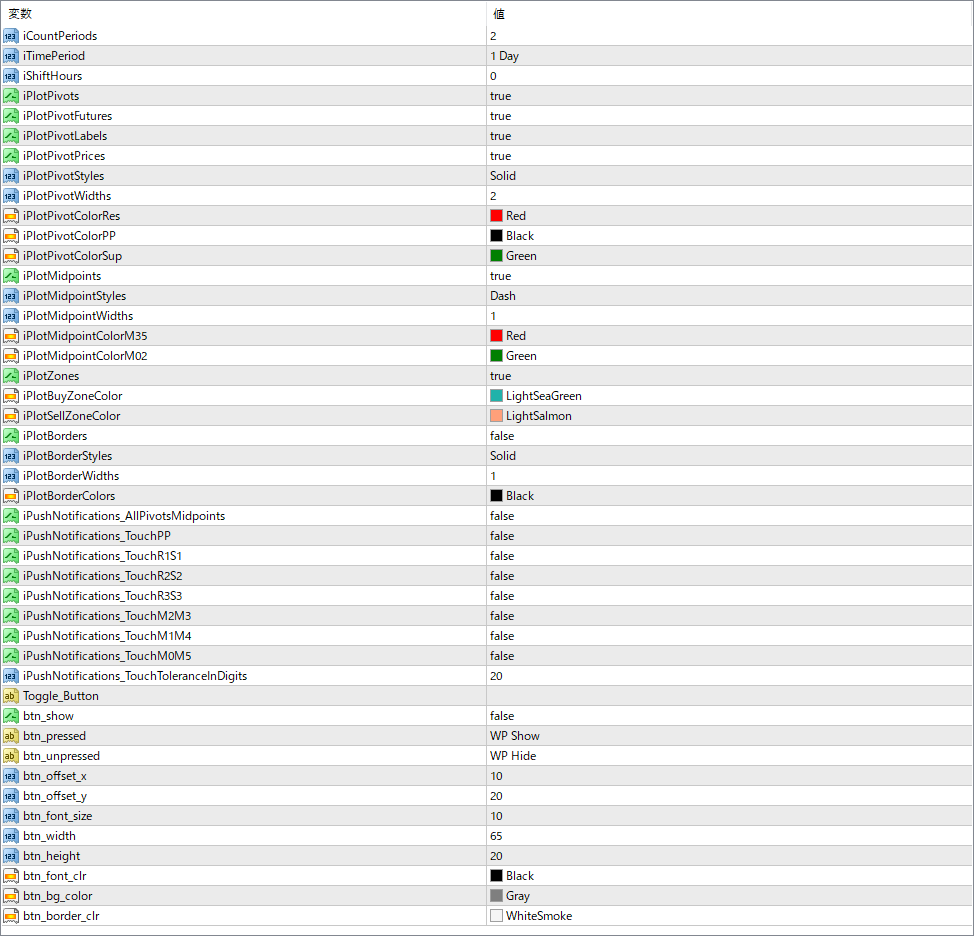
iCountPeriods
Sets how many previous periods are used to calculate the pivots.
iTimePeriod
Defines the base timeframe for pivot calculation (e.g., 1 Day).
iShiftHours
Adjusts the time shift of the pivot calculation to align with custom session starts.
iPlotPivots
Enables or disables the display of pivot levels.
iPlotPivotFutures
Shows projected future pivots beyond the current session.
iPlotPivotLabels
Controls whether labels are displayed on pivot lines.
iPlotPivotPrices
Displays price values next to pivot labels.
iPlotPivotStyles
Defines the style (solid, dashed, etc.) of pivot lines.
iPlotPivotWidths
Sets the line width for pivot lines.
iPlotPivotColorRes
Color used for resistance lines (R1–R4).
iPlotPivotColorPP
Color for the central pivot point (PP).
iPlotPivotColorSup
Color used for support lines (S1–S4).
iPlotMidpoints
Enables midpoint lines between pivot levels.
iPlotMidpointStyles
Sets the line style for midpoint lines.
iPlotMidpointWidths
Sets the line width for midpoint levels.
iPlotMidpointColorM35
Color of the midpoint above the PP.
iPlotMidpointColorM02
Color of the midpoint below the PP.
iPlotZones
Displays shaded zones between key pivot levels for better visualization.
iPlotBuyZoneColor
Sets the background color of the buy zone (support area).
iPlotSellZoneColor
Sets the background color of the sell zone (resistance area).
iPlotBorders
Toggles borders around zones on or off.
iPlotBorderStyles
Sets the line style for the zone borders.
iPlotBorderWidths
Sets the width of the border lines.
iPlotBorderColors
Defines the color of the zone borders.