Indicator Overview
The zig-zag-2-line-indicator 1.3 draws clean zigzag swing lines based on market highs and lows. It helps traders visualize major swing points and structural turns in price without noise. By connecting significant peaks and troughs, the indicator highlights the underlying movement direction and makes it easier to understand market structure at a glance.
This tool is useful for identifying swing highs, swing lows, trend direction, and potential reversal points. Because it filters out minor fluctuations, it provides a simplified view of price action that supports pattern recognition and structural analysis.
How to Use It in Practice
In practical trading, the zig-zag-2-line-indicator 1.3 can be used to:
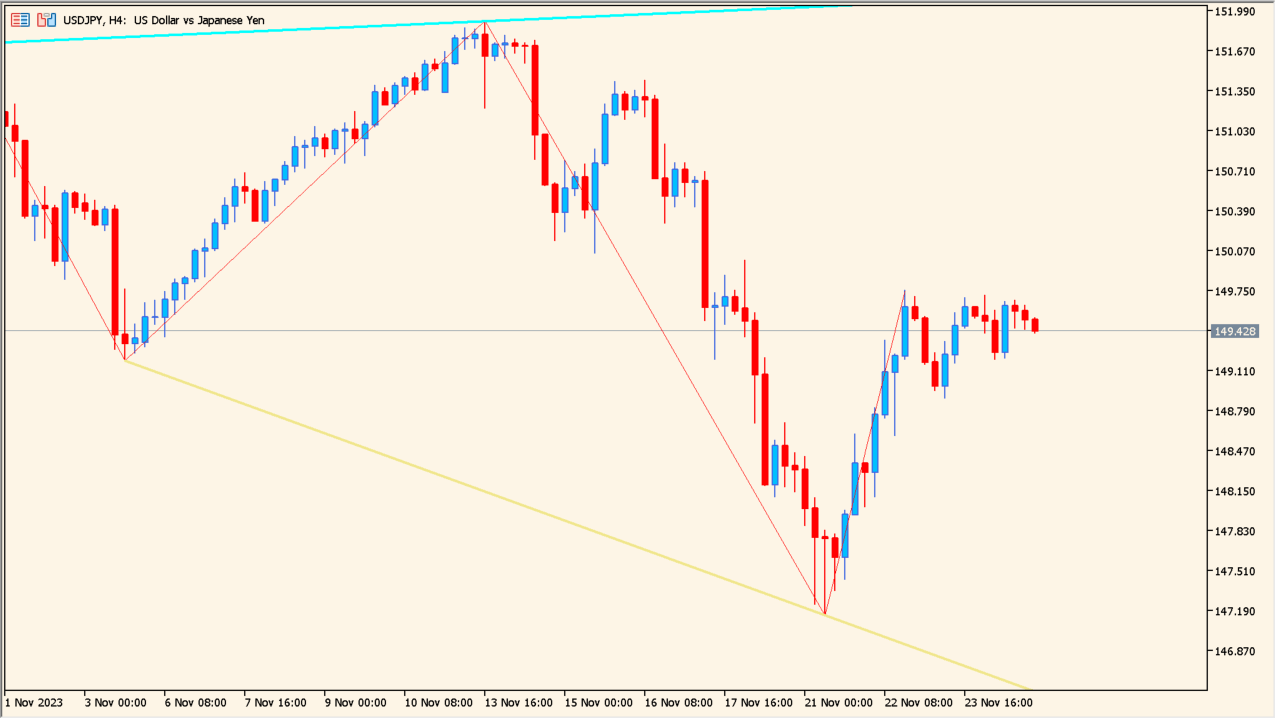
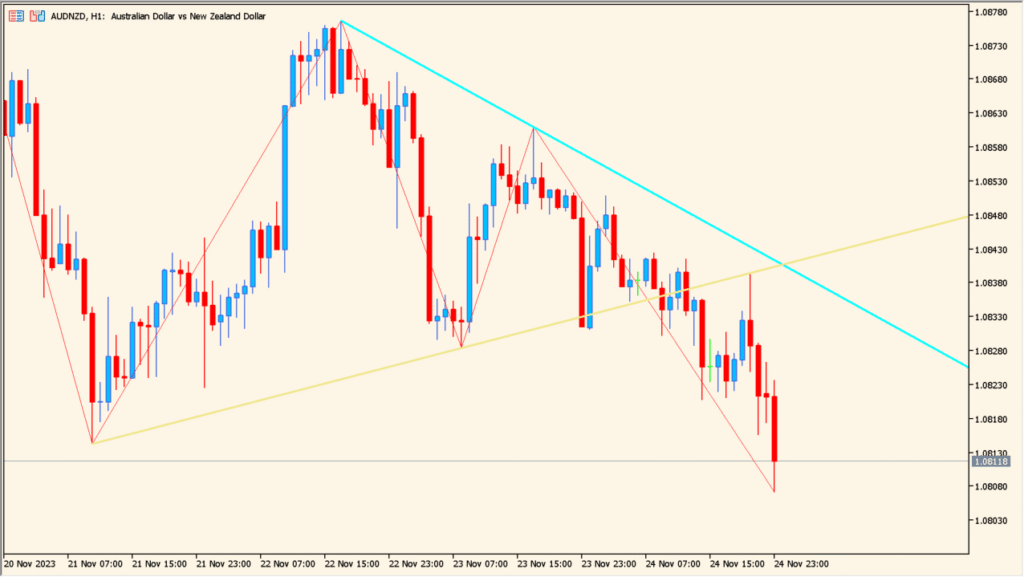
- Identify key swing highs and lows for structure analysis.
- Spot trend changes when the zigzag direction shifts.
- Assist in drawing trendlines by following major swing points.
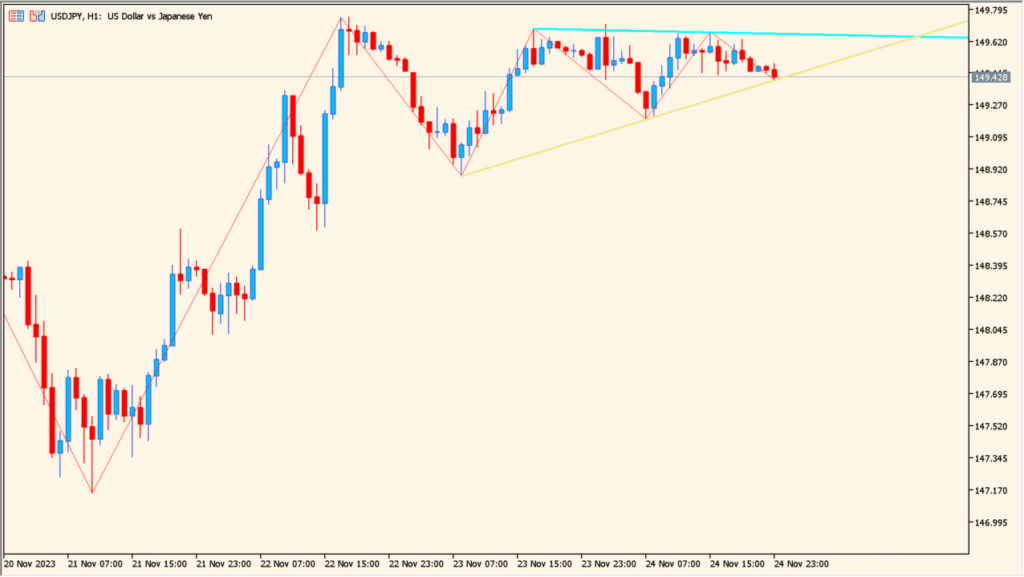
- Support pattern identification such as double tops, double bottoms, and ABCD structures.
- Filter noise to focus on meaningful price movement.
The indicator does not generate signals on its own but acts as a visual guide to better understand market rhythm and identify actionable price areas.
Parameter Explanations
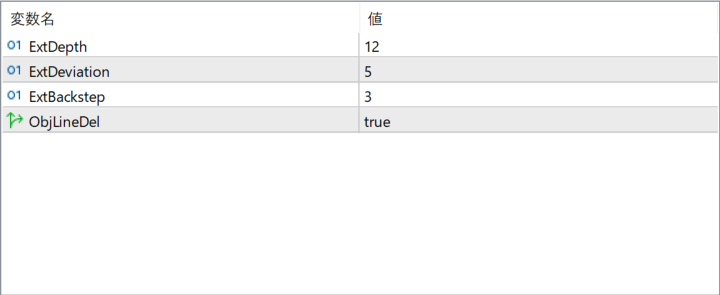
ExtDepth
Defines how many bars are considered when searching for significant highs and lows. A higher value creates fewer but more meaningful swing points.
ExtDeviation
Sets the minimum price deviation required to form a swing point. Larger values filter out small fluctuations.
ExtBackstep
Controls the minimum distance between swing points to avoid overlapping or too-frequent reversals.
ObjLineDel
Determines whether old zigzag lines should be removed automatically when new ones are drawn.