Overview of the ZigzagColor Indicator
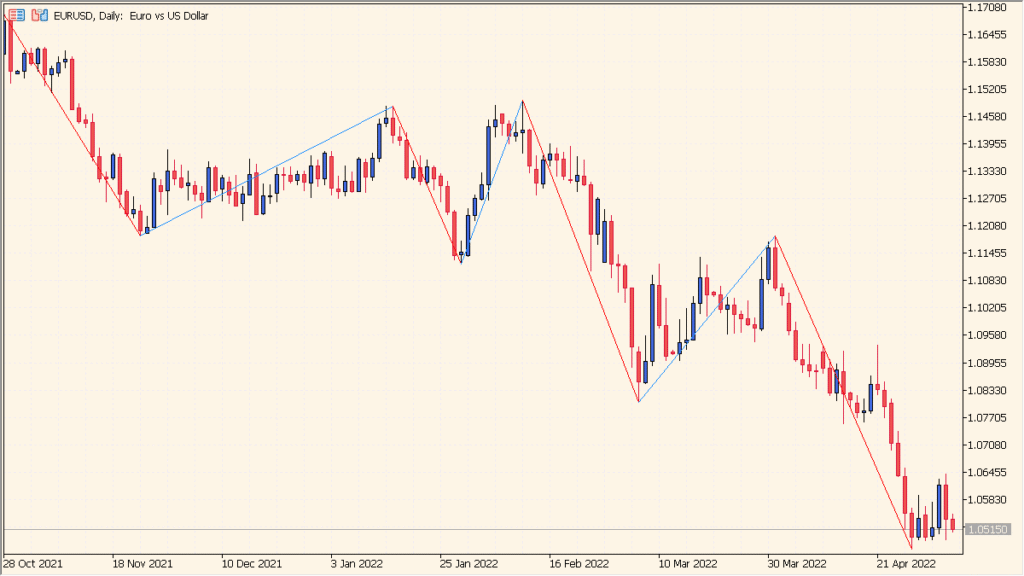
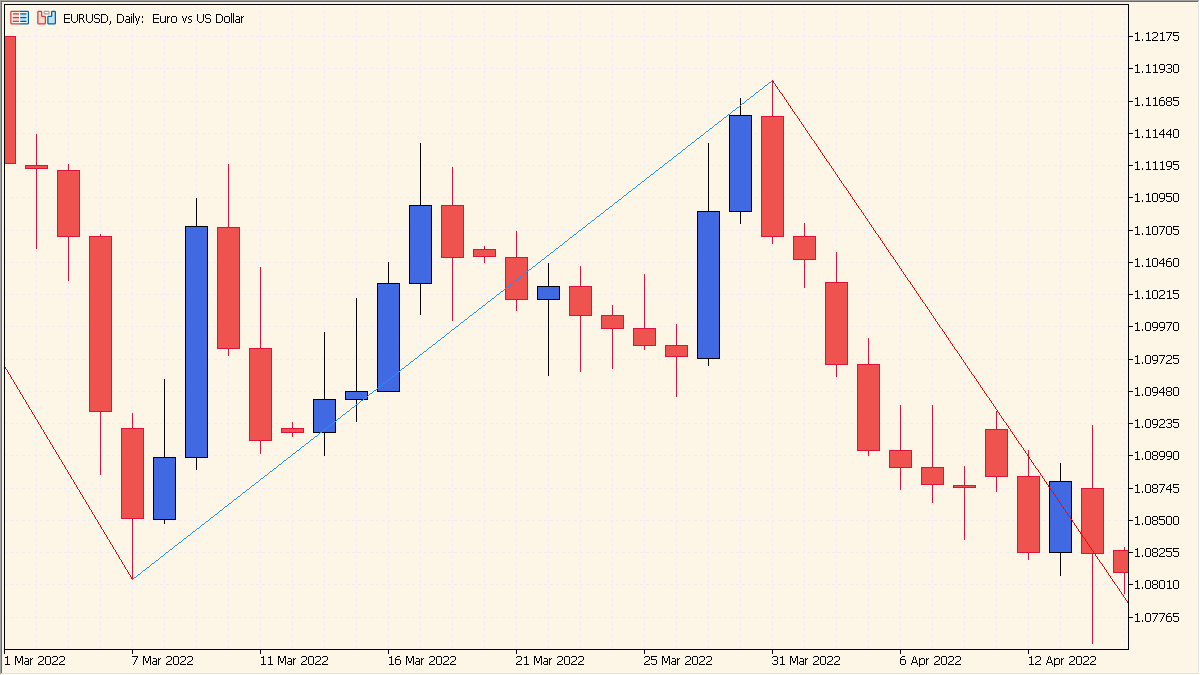
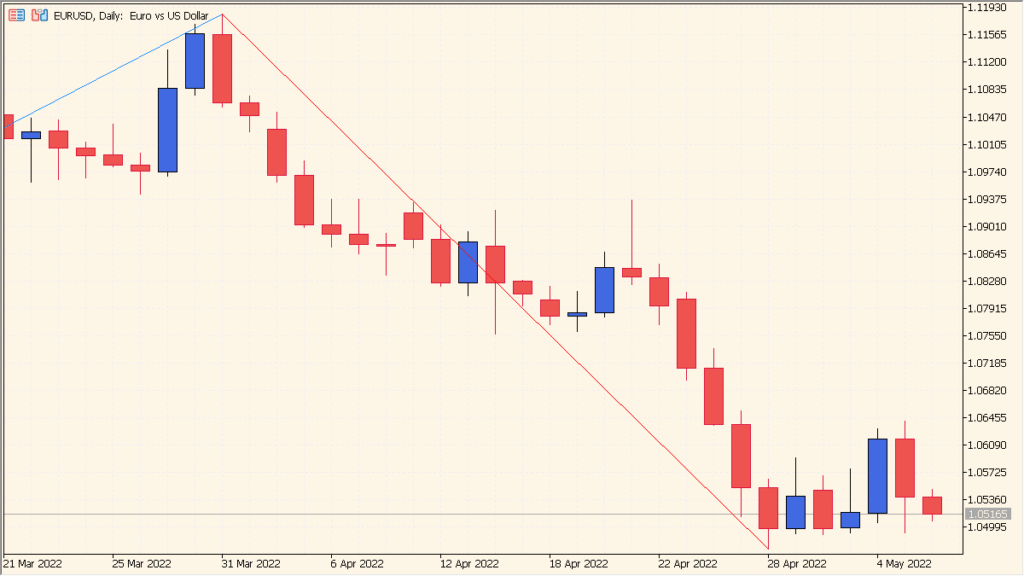
The ZigzagColor indicator for MT4 highlights significant price swings by connecting high and low points on the chart. It helps traders visualize the overall structure of market movements and identify potential trend reversals. The indicator colors the zigzag legs differently to make bullish and bearish phases easy to distinguish.
This tool doesn’t generate trading signals but provides a clean representation of price waves, making it useful for spotting higher highs, lower lows, and general market direction.
How to Use It in Practice
In practice, traders use the ZigzagColor indicator to:
- Identify swing highs and lows to understand market structure.
- Filter out market noise by focusing on major price movements.
- Combine with other indicators (like Fibonacci tools or support/resistance) for confirmation.
- Analyze trend strength and direction visually through color changes.
It’s particularly helpful for price action traders and those who prefer clean chart analysis without clutter.
Parameter Explanations
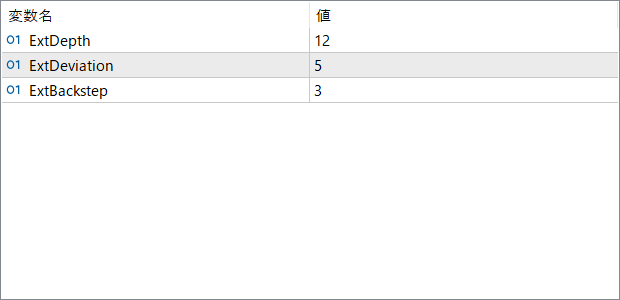
ExtDepth
Defines how many bars are considered when determining swing highs and lows. A higher value filters out smaller price movements and shows only major swings.
ExtDeviation
Specifies the minimum deviation (in points or percentage) required for a new zigzag leg to form. This controls sensitivity to price fluctuations.
ExtBackstep
Sets the minimum number of bars between two consecutive swing points. It prevents too frequent reversals from appearing on the chart.